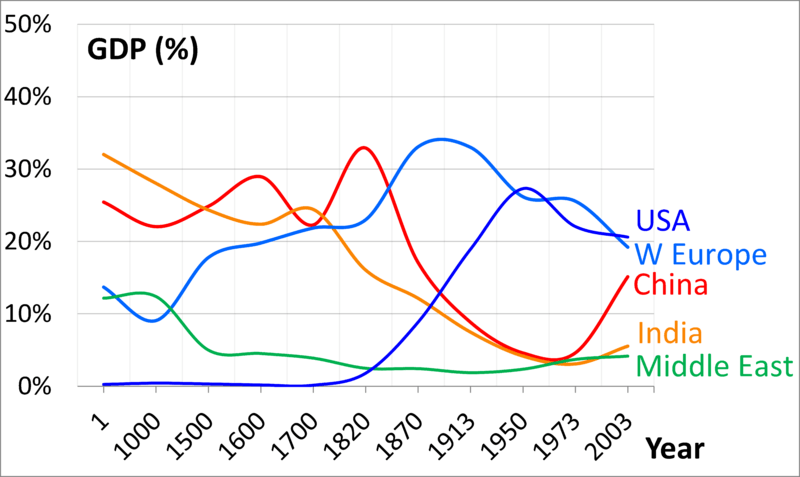
Image: 1 AD to 2003 AD Historical Trends in global distribution of GDP China India Western Europe USA Middle East

Description: This map shows the evolution of global economies over 2000 years, in terms of percent GDP contribution by each major economy over history. The chart plots the data from the published tables of Angus Maddison, the British Economist. The %GDP of Western Europe in the chart is the region in Europe that includes the following modern countries - UK, France, Germany, Italy, Belgium, Switzerland, Denmark, Finland, Sweden, Norway, Netherlands, Portugal, Spain and other smaller states in the Western part of Europe. The %GDP of Middle East in the chart is the region in West Asia and Northeast Africa that includes the following modern countries - Egypt, Israel, Palestinian Territories, Lebanon, Syria, Turkey, Jordan, Saudi Arabia, Qatar, Bahrain, Kuwait, UAE, Oman, Yemen, Iran, Iraq and other regions in the Arabian region. Data Source: Maddison A (2007), Contours of the World Economy I-2030AD, Oxford University Press, ISBN 978-0199227204 The data can be downloaded in spreadsheet format here. The data can also be viewed in a different graph here, as prepared by Ken Henry (Secretary to the Treasury, Australian Government, 18 May 2010).
Title: 1 AD to 2003 AD Historical Trends in global distribution of GDP China India Western Europe USA Middle East
Credit: Own work
Author: M Tracy Hunter
Usage Terms: Creative Commons Attribution-Share Alike 4.0
License: CC BY-SA 4.0
License Link: http://creativecommons.org/licenses/by-sa/4.0
Attribution Required?: Yes
Image usage
The following 3 pages link to this image:

