
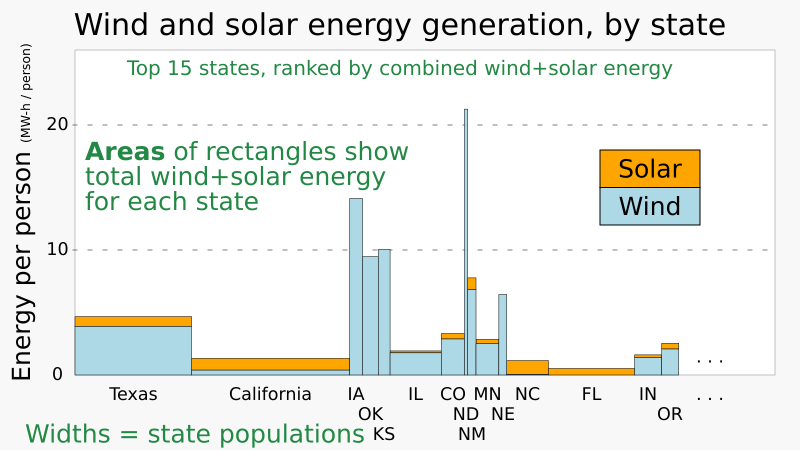
Image: 2022 Wind and solar energy generation leaders among U.S. states - variable width bar chart - IEA data

Description: Variable width (variwide) bar chart (column chart) showing wind and solar energy generated in 15 largest wind+solar generating states in the U.S., showing energy per person (vertical axis) and energy per state (area of rectangles) Data source: Gearino, Dan One State Generates Much, Much More Renewable Energy Than Any Other, and It’s Not California / Here’s a state-by-state tally of the leaders and laggards for wind, solar and other renewable energy in 2022.. Inside Climate News (9 March 2023). Archived from the original on 9 March 2023. (archive of chart) Gearino cites IEA as data source, crediting Paul Horn for a related bar chart. ● Population data from Table 2: Resident Population for the 50 States, the District of Columbia, and Puerto Rico: 2020 Census. Census.gov. United States Census Bureau (2021). Archived from the original on 6 March 2023. Source states: "ranked by combined totals, 2022" Excel spreadsheet used to generate SVG code for chart's bars: click Text, chart outlines and gridlines were added manually in text editor. This SVG file contains embedded text that can be translated into your language, using any capable SVG editor, text editor or the SVG Translate tool. For more information see: About translating SVG files.
Title: 2022 Wind and solar energy generation leaders among U.S. states - variable width bar chart - IEA data
Credit: Own work
Author: RCraig09
Usage Terms: Creative Commons Attribution-Share Alike 4.0
License: CC BY-SA 4.0
License Link: https://creativecommons.org/licenses/by-sa/4.0
Attribution Required?: Yes
Image usage
The following page links to this image:
