
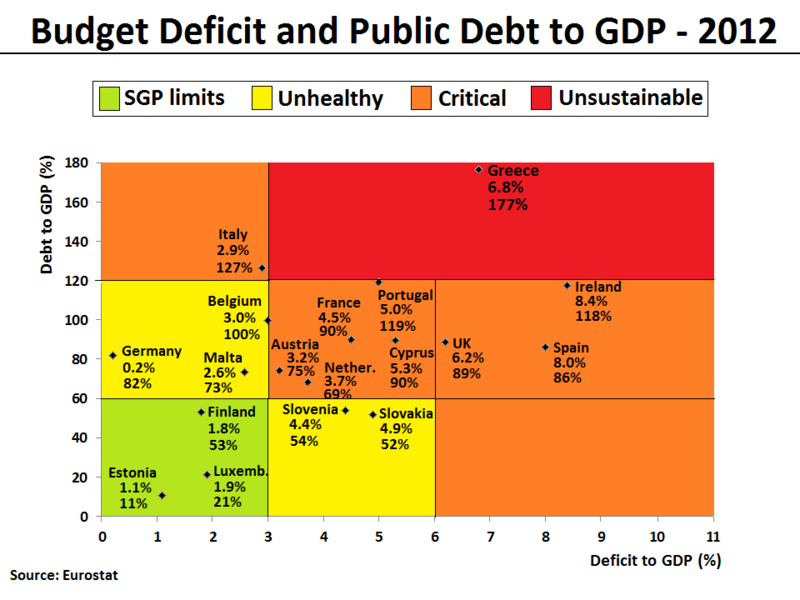
Image: Budget Deficit and Public Debt to GDP in 2012 (for selected EU Members)
Description: The Debt-to-GDP ratio and Budget deficit to GDP ratio have been plotted for all eurozone countries and UK in 2012. The same plot can also be found here with 2009 figures. The figures indicate the fiscal health of the countries in the plot. Generally, the farther up and to the right a country goes, the higher the risk for investors. The following 4 areas have been given a background color in the plot to reflect the level of fiscal health: Green (max.60% debt-to-GDP and max.3% deficit), maps the European limits outlined by the Stability and Growth Pact. Yellow (60-120% debt-to-GDP if the deficit is below 3%, OR 0-60% debt-to-GDP with a 3-6% deficit), maps the area considered to be unhealthy on the long term. All countries belonging to the area will comply with 1 out of 2 SGP limits and be close to comply with both SGP limits, which mean that the situation is not yet at a "critical" state. Orange (min.120% debt-to-GDP if the deficit is below 3%, OR 60-120% debt-to-GDP if the deficit is above 3%, OR 0-60% debt-to-GDP if the deficit is above 6%), covers the three areas commonly referred to as critical levels. Red (if the debt-to-GDP exceeds 120% in combination with having a deficit above 3%). In this area, the situation (according to IMF guidelines) is considered to be "unsustainable". As a general rule of thumb, it is only possible for a country to enter a path of continuously declining debt-to-GDP ratios if it succeeds to achieve budget deficits below 3% of GDP; and IMF have argued this for an average-country will not be possible (without external help) if the debt suddenly exceeds the 120% limit. Trend over time is important to map. In example, a critical deficit (bigger than 6%) in a single year might occur only because of special temporary one-off circumstances, and if forecasts promise it will by-it-self return to more normal levels in subsequent years (while the debt level also still remain below 120%), then it will in such a situation not be evaluated as being truly critical (despite of having a critical size for a specific year).
Title: Budget Deficit and Public Debt to GDP in 2012 (for selected EU Members)
Credit: Own work. Data for the chart is from the Eurostat database[1][2], which normally will be identical with the European Commision's AMECO database[3][4]. In the current version of the file, the figures are based on recorded data for the first 3 quarters and forecasted data for the last 4th quarter of 2012. The data can also be found published by the European Commission's latest Autumn Economic Forecast 2012 report.
Author: Danish Expert
Usage Terms: Creative Commons Attribution-Share Alike 3.0
License: CC BY-SA 3.0
License Link: https://creativecommons.org/licenses/by-sa/3.0
Attribution Required?: Yes
Image usage
The following page links to this image:

.png)