
Image: CMIP climate model progress
Size of this preview: 759 × 600 pixels. Other resolutions: 304 × 240 pixels | 2,128 × 1,682 pixels.
Original image (2,128 × 1,682 pixels, file size: 183 KB, MIME type: image/jpeg)
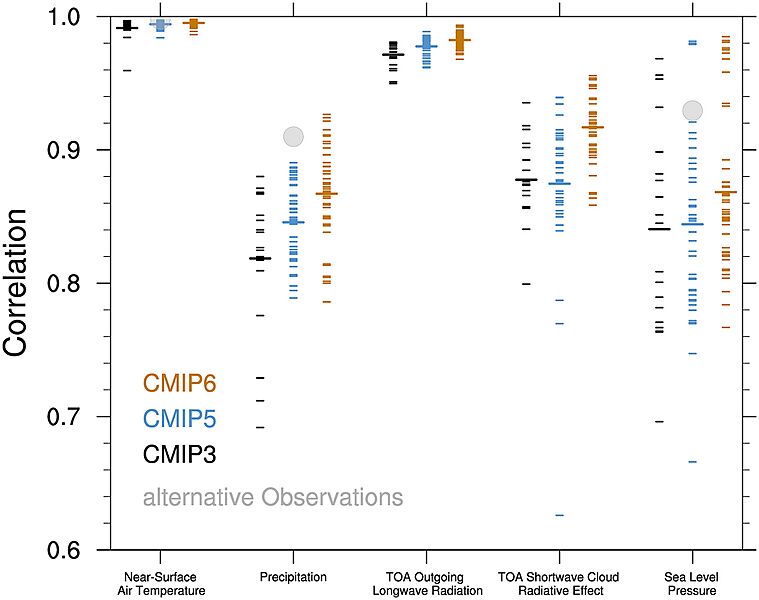
Description: Graph shows the improving pattern correlation (y-axis) between climate models and climate observations (x-axis) during CMIP phases 3, 5, and 6. Results are shown for individual CMIP3 (black), CMIP5 (blue), and CMIP6 (brown) models as short lines, along with the corresponding ensemble averages (long lines). Annual mean climatology was assessed over the period 1980–1999.
Author: L. Bock, A. Lauer, M. Schlund, M. Barreiro, N. Bellouin, C. Jones, G. A. Meehl, V. Predoi, M. J. Roberts, V. Eyring
Usage Terms: Creative Commons Attribution-Share Alike 3.0
License: CC-BY-SA-3.0
License Link: http://creativecommons.org/licenses/by-sa/3.0/
Attribution Required?: Yes
Image usage
The following page links to this image:

All content from Kiddle encyclopedia articles (including the article images and facts) can be freely used under Attribution-ShareAlike license, unless stated otherwise.