
Image: Cause of change in U.S. debt position 2001-2011
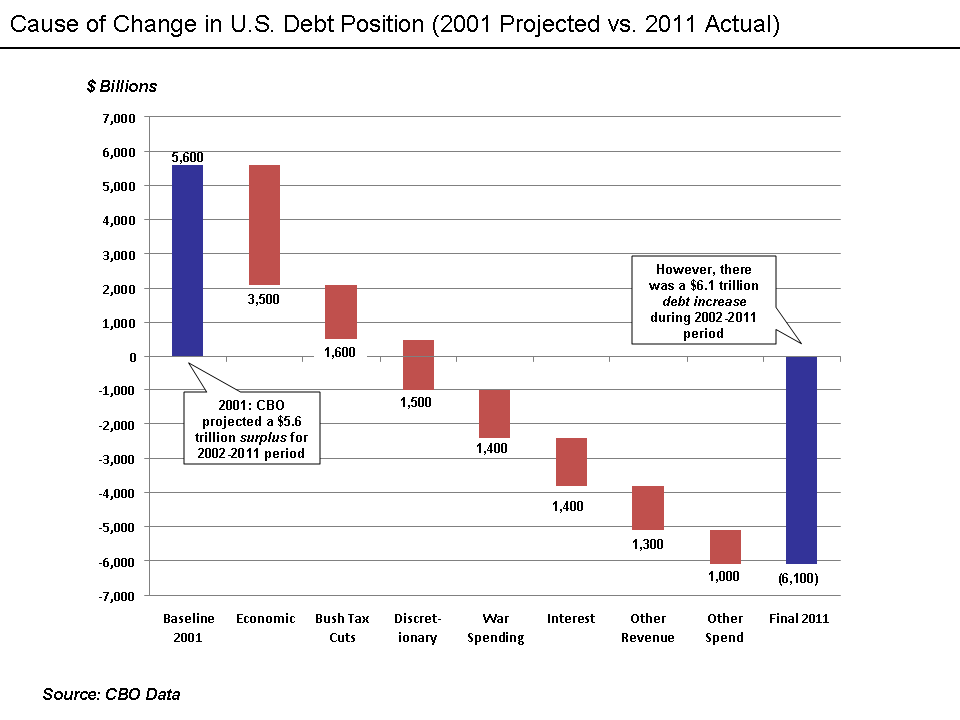
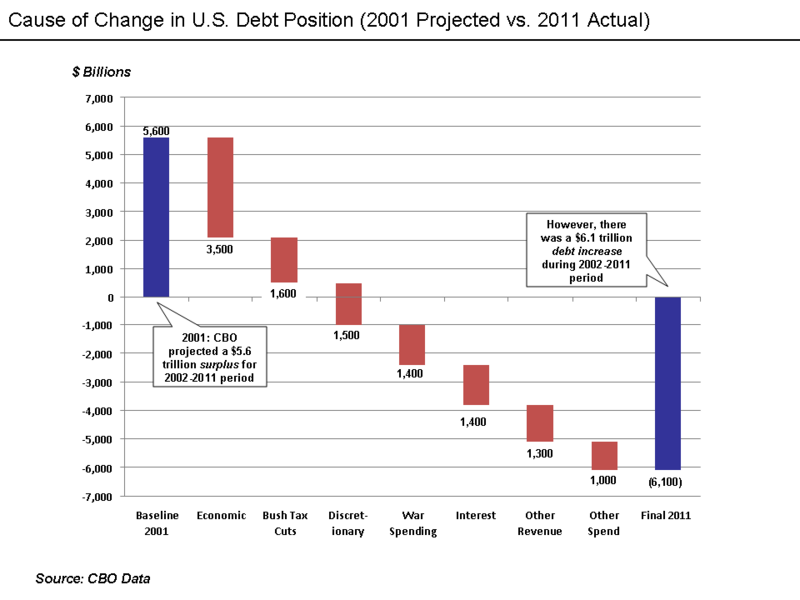
Description: This shows the CBO's explanation for cause of change between their 2001 estimate of $5.6 trillion surplus for 2002-2011 period versus the $6.1 trillion debt increase that actually occurred. Understanding the chart CBO analyzed the cause of change between: Their 2001 baseline estimate, which projected that cumulatively from 2002-2012 there would be a $5.6 trillion surplus. The $6.1 trillion in debt increases that actually occurred during the 2002-2012 period.[1] There is a detailed table in their analysis that is summarized in the chart. CBO wrote: "In January 2001, CBO's baseline projections showed a cumulative surplus of $5.6 trillion for the 2002–2011 period. The actual results have differed from those projections because of subsequent policy changes, economic developments that differed from CBO's forecast, and other factors. As a result, the federal government ran deficits from 2002 through 2011. The cumulative deficit over the 10-year period amounted to $6.1 trillion—a swing of $11.7 trillion from the January 2001 projections." Economic: The effects of the recessions of 2001 and 2008-2009, which includes revenue declines due to lower levels of employment and economic activity and higher levels of safety net spending. Bush tax cuts: See the Bush tax cuts for more information. War Spending: CBO did not specifically identify the $1.4 trillion amount for war spending in the cause of change analysis. This amount appears in a different publication for the September 2001-2011 period.[2] Discretionary: Since the war spending of $1.4 trillion is part of the discretionary change total of $2.9 trillion in the CBO's cause of change analysis, a $1.5 trillion discretionary block was included in the chart to total the $2.9 total amount. The $1.5 trillion includes other increases in the baseline defense budget and other cabinet departments and agencies. Interest: Interest is higher than projected due to higher debt than projected. Other revenue: The impact of a variety of tax cuts other than the Bush tax cuts, such as tax cuts from stimulus and payroll tax cuts. Other spend: Stimulus, TARP, and other spending above projected amounts.
Title: Cause of change in U.S. debt position 2001-2011
Credit: I used CBO data to create this chart Previously published: No other publication
Author: Farcaster
Usage Terms: Creative Commons Attribution-Share Alike 3.0
License: CC BY-SA 3.0
License Link: https://creativecommons.org/licenses/by-sa/3.0
Attribution Required?: Yes
Image usage
The following page links to this image:
