
History of the United States public debt facts for kids
The history of the United States public debt tells us how much money the U.S. government has borrowed over time. This borrowing started during the American Revolutionary War in 1776. The U.S. has almost always had some public debt, except for a short time in 1835-1836.
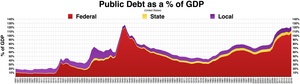
To understand how big the debt is, we often compare it to the country's total economic output, called gross domestic product (GDP). Think of GDP as the total value of all goods and services produced in the country. Historically, the U.S. public debt usually grows during wars and economic slowdowns (recessions). It then tends to shrink afterward.
The debt was highest compared to GDP after World War II, during President Harry Truman's time. It then dropped quickly during a strong economic period after the war, reaching a low point in 1973 under President Richard Nixon. Since then, the debt has generally grown, except when Presidents Jimmy Carter and Bill Clinton were in office.
The debt grew a lot in the 1980s when President Ronald Reagan lowered taxes and spent more on the military. It went down in the 1990s because military spending decreased, taxes increased, and the economy was booming. The debt also jumped after the 2008 financial crisis and again during the COVID-19 pandemic. These increases were due to less tax money coming in and more government spending to help the economy.


Contents
Early History of U.S. Debt

How the U.S. Started with Debt
The United States has had public debt almost continuously since its Constitution began in 1789. During the American Revolution, the first government, under the Articles of Confederation, borrowed a lot of money for the war. However, it didn't have the power to collect enough taxes to pay these debts back.
Hamilton's Financial Plan
When the U.S. was new, its money situation was very messy. In 1790, Alexander Hamilton, the first Secretary of the Treasury, suggested a big financial plan. A key part of his plan was for the new federal government to take over the debts that individual states had from the Revolutionary War.
Northern states had large war debts and wanted the federal government to help. Southern states, with less debt, didn't want their citizens to pay for other states' debts. James Madison and others from the South initially opposed this.
The Compromise of 1790
Eventually, a deal was made, known as the Compromise of 1790. The federal government agreed to take on all the state debts. In return, the permanent capital of the U.S. would be located in the South, in what became the District of Columbia. This plan helped the new national government become stronger by managing the country's finances. It also helped the U.S. gain trust from other countries and investors.
Paying Off the Debt: A Rare Moment
After the War of 1812, the U.S. government worked hard to reduce its debt. On January 8, 1835, President Andrew Jackson achieved something unique: he paid off the entire national debt! This is the only time in U.S. history this has happened. However, the government soon had to borrow money again after an economic crisis called the Panic of 1837.
Debt During the Civil War
The debt grew sharply again during the American Civil War. It went from $65 million in 1860 to $2.7 billion by the end of the war. After the war, the government managed to pay off more than half of this debt over the next 47 years.
Debt During World Wars and Economic Hardship
World War I Debt
The U.S. debt grew significantly during World War I (1914–1918). To help pay for the war, the government sold Liberty Bonds to the public. These bonds were like loans from citizens to the government. After the war, the government managed to reduce the debt by 36% through careful spending and economic growth in the 1920s.
The Great Depression's Impact
When the Great Depression hit in the 1930s, the economy struggled. Many people lost their jobs, and businesses closed. This meant the government collected less tax money. To help people and the economy, President Franklin D. Roosevelt's government spent more on social programs. This caused the debt to grow, reaching about 40% of GDP by 1936.
World War II Debt Surge
The biggest increase in U.S. public debt happened during World War II. To pay for the war effort, the debt rose to over 100% of GDP by 1945. This shows how much the country spent to mobilize and fight in the war.
After World War II: Debt Trends

Post-War Decline and 1970s Rise
After World War II, the public debt, as a percentage of GDP, quickly fell. This was thanks to a strong economic boom in the U.S. and around the world. Unlike previous conflicts, the Korean War (1950–53) was mostly paid for by taxes, so it didn't cause the debt to increase much.
However, starting in the mid-1970s, the U.S. national debt began to grow faster than the GDP. In 1974, the debt reached a low of 24.6% of GDP. After that, new budget rules made it harder to control government spending, and the debt started to climb again.
The 1980s and 1990s Debt Changes
The debt grew rapidly in the 1980s. President Ronald Reagan's economic policies lowered tax rates and increased military spending. At the same time, Congress didn't cut social programs. This led to the debt increasing from 26.2% of GDP in 1980 to 40.9% in 1988. It continued to rise under President George H. W. Bush, reaching 48.3% of GDP by 1992.

During President Bill Clinton's time, the debt decreased significantly. This was due to less military spending, increased taxes, and a strong economy in the 1990s. The debt fell from 49.5% of GDP at the start of his term to 34.5% by the end.
21st Century Debt Increases
In the early 2000s, the debt started to rise again. This was partly due to tax cuts under President George W. Bush and increased military spending for wars in the Middle East. The debt also grew significantly after the 2008 financial crisis. This crisis caused tax revenues to drop and government spending to increase to help the economy.
2011 Credit Rating Downgrade
On August 5, 2011, a company called Standard & Poor's lowered the U.S. government's credit rating. This was the first time the U.S. had its rating lowered since 1917. It meant that Standard & Poor's had less confidence in the government's ability to make financial decisions.
Why the Debt Changed Recently
Public debt grows when the government spends more money than it collects in taxes. This difference is called a budget deficit.
Comparing 2001 to 2009

The U.S. last had a budget surplus in 2001, meaning it collected more money than it spent. From 2001 to 2009, government spending increased, and tax collections decreased. Spending went up for healthcare programs like Medicare and Medicaid, defense, and social safety net programs. Tax collections went down because of individual income tax cuts and other factors.
Key Reasons for Debt Increase (2001-2011)
Experts looked at why the debt grew so much between 2001 and 2011. They found several main reasons:
- Economic changes: Lower tax money and more spending on safety net programs during economic slowdowns.
- Tax cuts: Laws like the Bush Tax Cuts reduced how much tax people and companies paid.
- Increased spending: More money was spent on non-defense programs.
- Wars: The wars in Afghanistan and Iraq cost a lot of money.
- Interest: The government had to pay more interest on its growing debt.
- Stimulus and tax cuts: Programs like the American Recovery and Reinvestment Act helped the economy but also added to the debt.
Historical Debt Levels
Gross Federal Debt
This table shows the total U.S. federal debt as a percentage of gross domestic product (GDP) since World War II. The gross federal debt includes money the government owes to itself, like to Social Security programs.
| Congressional session | Years | President | President's party | Debt-to-GDP ratio at start of period | Debt-to-GDP ratio at end of period | Change in debt (in billions of dollars) | Change in debt-to-GDP ratio (in percentage points) |
|---|---|---|---|---|---|---|---|
| 77–78 | 1941–1945 | Roosevelt | Democratic | 100% | 117.5% | +203 | +67.1 |
| 79–80 | 1945–1949 | Roosevelt, Truman | Democratic | 117.5% | 93.1% | -8 | -24.4 |
| 81–82 | 1949–1953 | Truman | Democratic | 93.1% | 71.4% | +13 | -21.7 |
| 83–84 | 1953–1957 | Eisenhower | Republican | 71.4% | 60.4% | +6 | -11.0 |
| 85–86 | 1957–1961 | Eisenhower | Republican | 60.4% | 55.2% | +20 | -5.2 |
| 87–88 | 1961–1965 | Kennedy, Johnson | Democratic | 55.2% | 46.9% | +30 | -8.3 |
| 89–90 | 1965–1969 | Johnson | Democratic | 46.9% | 38.6% | +43 | -8.3 |
| 91–92 | 1969–1973 | Nixon | Republican | 38.6% | 35.6% | +101 | -3.0 |
| 93–94 | 1973–1977 | Nixon, Ford | Republican | 35.6% | 35.8% | +177 | +0.2 |
| 95–96 | 1977–1981 | Carter | Democratic | 35.8% | 32.5% | +288 | -3.3 |
| 97–98 | 1981–1985 | Reagan | Republican | 32.5% | 43.8% | +823 | +11.3 |
| 99–100 | 1985–1989 | Reagan | Republican | 43.8% | 53.1% | +1,050 | +9.3 |
| 101–102 | 1989–1993 | Bush Sr. | Republican | 53.1% | 66.1% | +1,483 | +13.0 |
| 103–104 | 1993–1997 | Clinton | Democratic | 66.1% | 65.4% | +1,018 | -0.7 |
| 105–106 | 1997–2001 | Clinton | Democratic | 65.4% | 56.4% | +401 | -9.0 |
| 107–108 | 2001–2005 | Bush | Republican | 56.4% | 63.5% | +2,135 | +7.1 |
| 109–110 | 2005–2009 | Bush | Republican | 63.5% | 84.2% | +3,971 | +20.7 |
| 111–112 | 2009–2013 | Obama | Democratic | 84.2% | 102.7% | +6,061 | +18.5 |
Publicly Held Debt
Publicly held debt is the part of the gross debt that the government owes to outside investors, like individuals, businesses, and foreign governments. It does not include money the government owes to its own programs, such as the Social Security Trust Funds.
Federal Spending, Debt, and GDP
This table shows how much the federal government spent, its total debt, and the country's total economic output (GDP) for certain years. The government's fiscal year runs from October 1 of the previous year to September 30 of the year shown.
| Fiscal year | Federal spending | Federal debt | Gross domestic product | Inflation adjuster | ||||||
|---|---|---|---|---|---|---|---|---|---|---|
| Billions | Adjusted | Change | Billions | Adjusted | Change | Billions | Adjusted | Change | ||
| 1977 | $409 | $1,040 | $705 | $1,795 | $1,974 | $5,019 | 0.39 | |||
| 1978 | $459 | $1,093 | 5.1% | $776 | $1,850 | 3.1% | $2,217 | $5,285 | 5.3% | 0.42 |
| 1979 | $504 | $1,107 | 1.3% | $829 | $1,821 | −1.5% | $2,501 | $5,494 | 4.0% | 0.46 |
| 1980 | $591 | $1,175 | 6.1% | $909 | $1,808 | −0.8% | $2,727 | $5,422 | −1.3% | 0.50 |
| 1981 | $678 | $1,219 | 3.8% | $994 | $1,787 | −1.1% | $3,055 | $5,492 | 1.3% | 0.56 |
| 1982 | $746 | $1,252 | 2.6% | $1,137 | $1,908 | 6.8% | $3,228 | $5,417 | −1.4% | 0.60 |
| 1983 | $808 | $1,294 | 3.4% | $1,371 | $2,195 | 15.0% | $3,441 | $5,510 | 1.7% | 0.62 |
| 1984 | $852 | $1,300 | 0.4% | $1,564 | $2,386 | 8.7% | $3,840 | $5,858 | 6.3% | 0.66 |
| 1985 | $946 | $1,396 | 7.4% | $1,817 | $2,680 | 12.3% | $4,142 | $6,108 | 4.3% | 0.68 |
| 1986 | $990 | $1,426 | 2.1% | $2,120 | $3,052 | 13.9% | $4,412 | $6,352 | 4.0% | 0.69 |
| 1987 | $1,004 | $1,406 | −1.4% | $2,345 | $3,283 | 7.6% | $4,647 | $6,506 | 2.4% | 0.71 |
| 1988 | $1,065 | $1,447 | 2.9% | $2,601 | $3,534 | 7.7% | $5,009 | $6,806 | 4.6% | 0.74 |
| 1989 | $1,144 | $1,499 | 3.6% | $2,867 | $3,757 | 6.3% | $5,401 | $7,077 | 4.0% | 0.76 |
| 1990 | $1,253 | $1,590 | 6.1% | $3,206 | $4,067 | 8.3% | $5,735 | $7,277 | 2.8% | 0.79 |
| 1991 | $1,324 | $1,610 | 1.3% | $3,598 | $4,374 | 7.5% | $5,935 | $7,215 | −0.8% | 0.82 |
| 1992 | $1,382 | $1,624 | 0.9% | $4,001 | $4,703 | 7.5% | $6,240 | $7,334 | 1.7% | 0.85 |
| 1993 | $1,410 | $1,615 | −0.5% | $4,351 | $4,987 | 6.0% | $6,576 | $7,536 | 2.8% | 0.87 |
| 1994 | $1,462 | $1,642 | 1.7% | $4,643 | $5,216 | 4.6% | $6,961 | $7,820 | 3.8% | 0.89 |
| 1995 | $1,516 | $1,662 | 1.2% | $4,920 | $5,395 | 3.4% | $7,326 | $8,033 | 2.7% | 0.91 |
| 1996 | $1,561 | $1,673 | 0.7% | $5,181 | $5,554 | 3.0% | $7,694 | $8,248 | 2.7% | 0.93 |
| 1997 | $1,601 | $1,684 | 0.7% | $5,369 | $5,647 | 1.7% | $8,182 | $8,606 | 4.3% | 0.95 |
| 1998 | $1,653 | $1,721 | 2.2% | $5,478 | $5,704 | 1.0% | $8,628 | $8,985 | 4.4% | 0.96 |
| 1999 | $1,702 | $1,746 | 1.5% | $5,605 | $5,750 | 0.8% | $9,125 | $9,361 | 4.2% | 0.97 |
| 2000 | $1,789 | $1,789 | 2.5% | $5,628 | $5,628 | −2.1% | $9,710 | $9,710 | 3.7% | 1.00 |
| 2001 | $1,863 | $1,821 | 1.8% | $5,769 | $5,638 | 0.2% | $10,058 | $9,829 | 1.2% | 1.02 |
| 2002 | $2,011 | $1,929 | 6.0% | $6,198 | $5,945 | 5.5% | $10,377 | $9,954 | 1.3% | 1.04 |
| 2003 | $2,160 | $2,018 | 4.6% | $6,760 | $6,316 | 6.2% | $10,809 | $10,099 | 1.4% | 1.07 |
| 2004 | $2,293 | $2,082 | 3.2% | $7,354 | $6,677 | 5.7% | $11,500 | $10,441 | 3.4% | 1.10 |
| 2005 | $2,472 | $2,165 | 4.0% | $7,905 | $6,923 | 3.7% | $12,238 | $10,717 | 2.6% | 1.14 |
| 2006 | $2,655 | $2,249 | 3.9% | $8,451 | $7,158 | 3.4% | $13,016 | $11,024 | 2.9% | 1.18 |
| 2007 | $2,730 | $2,263 | 0.6% | $8,951 | $7,419 | 3.6% | $13,668 | $11,329 | 2.8% | 1.21 |
| 2008 | $2,931 | $2,366 | 4.6% | $9,654 | $7,793 | 5.0% | $14,312 | $11,553 | 0% | 1.24 |
| 2009* | $3,107 | $2,452 | 3.6% | $10,413 | $8,218 | 5.5% | $14,097 | $11,529 | 2.6% | 1.27 |
| 2010* | $3,091 | $2,392 | −2.4% | $11,875 | $9,247 | 12.5% | $14,508 | $11,297 | −2.0% | 1.29 |
Images for kids
-
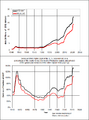
U.S. debt from 1940 to 2011. The red lines show "debt held by the public," and black lines show the total national debt. The difference is money the government owes to its own programs, like Social Security. The top graph shows debt in 2010 dollars; the bottom graph shows debt as a percentage of GDP.

See also
- First Report on the Public Credit
- United States federal budget
- Starve the beast (policy)
- United States public debt
- United States fiscal cliff
- 2011 U.S. debt ceiling crisis
- Government budget by country
- I.O.U.S.A., documentary film by Patrick Creadon
- Modern Monetary Theory
- Unemployment in the United States
- List of U.S. state budgets
- Continuing resolution
- Appropriations bill (United States)
- Deficit reduction in the United States
