
United States federal budget facts for kids
The United States budget is like a big financial plan for the U.S. federal government. It shows how much money the government expects to collect (called revenue) and how much it plans to spend. This budget reflects what the government cares about most, and it often involves debates about how the economy should work. The government mainly spends money on healthcare, retirement plans, and defense.
An independent group called the Congressional Budget Office (CBO) studies the budget and its effects on the economy. In 2024, the CBO estimated that the government's debt is growing. It's expected to go from 99% of the country's total economic output (GDP) in 2024 to 116% in 2034. This happens because the cost of interest on the debt and required spending (like for healthcare) is growing faster than the money coming in and the economy itself. This trend could push the debt even higher, to 172% of GDP by 2054.


Contents
Understanding the US Federal Budget
The budget usually starts with a plan from the President to Congress. This plan suggests how much money should be spent for the next fiscal year. A fiscal year starts on October 1st and ends on September 30th of the next year. For example, the 2024 fiscal year runs from October 1, 2023, to September 30, 2024.
However, Congress is the group that actually has the power to approve spending each year. They pass bills that decide how money is given to different government programs. These decisions follow specific rules about the federal budget process. If Congress doesn't agree on a full budget, they might pass "stop gap" measures to keep the government running.
Once Congress approves a spending bill, it goes to the President. The President can either sign it into law or reject it (called a veto). If a bill is vetoed, Congress can still make it law if two-thirds of both the House and Senate vote for it again. Sometimes, many spending bills are combined into one big bill. The President or Congress can also ask for extra money for emergencies, like after a big storm.
Several government groups help with budget information and analysis. These include the Government Accountability Office (GAO), the Congressional Budget Office (CBO), the Office of Management and Budget (OMB), and the Treasury Department. These groups have warned that the government faces big money challenges in the future. These challenges are mainly due to more older people needing support, rising interest payments on debt, and increasing costs for healthcare programs like Medicare and Medicaid.
How Much the Government Spent in 2022
In the 2022 fiscal year, the federal government spent about $6.3 trillion. This was 25.1% of the country's total economic output (GDP), which is higher than the average over the last 50 years.
The main areas of spending in 2022 included:
- Medicare and Medicaid (healthcare): $1.34 trillion (5.4% of GDP)
- Social Security (retirement and disability): $1.2 trillion (4.8% of GDP)
- Non-defense discretionary spending (running government agencies): $910 billion (3.6% of GDP)
- Defense Department (military): $751 billion (3.0% of GDP)
- Net interest (on the national debt): $475 billion (1.9% of GDP)
The CBO predicts that the government's budget deficit (spending more than it collects) will be $1.6 trillion in 2024. They expect this deficit to grow, reaching $2.6 trillion by 2034.
Recent Budget Numbers (as % of GDP)
This table shows how much the government collected, spent, and the size of its debt compared to the country's total economic output (GDP) from 2015 to 2022.
| Variable As % GDP | 2015 | 2016 | 2017 | 2018 | 2019 | 2020 | 2021 | 2022 | Hist Avg |
|---|---|---|---|---|---|---|---|---|---|
| Revenue | 18.0% | 17.6% | 17.2% | 16.4% | 16.4% | 16.2% | 17.9% | 19.6% | 17.4% |
| Outlays | 20.4% | 20.8% | 20.6% | 20.2% | 21.0% | 31.1% | 30.1% | 25.1% | 21.0% |
| Budget Deficit | -2.4% | -3.2% | -3.5% | -3.8% | -4.6% | -14.9% | -12.3% | -5.5% | -3.6% |
| Debt Held by Public | 72.5% | 76.4% | 76.2% | 77.6% | 79.4% | 100.3% | 99.6% | 94.7% |
How the Budget Works
The U.S. Constitution says that the government can only spend money if Congress approves it through laws. It also says that a record of all money collected and spent must be published regularly.
Every year, the President sends a budget request to Congress. This is required by a law from 1921. The President usually sends this budget in early February.
The federal budget mostly uses a "cash basis" system. This means money is counted when it's actually spent or received. It doesn't fully show the long-term costs of programs like Medicare and Social Security.
Government agencies can't spend money unless Congress gives them permission (called "authorization") and then provides the actual funds (called "appropriations"). Separate committees in Congress handle these two steps. The House and Senate Appropriations Committees have 12 subcommittees that write the 12 main spending bills for different federal programs. These bills must pass both the House and Senate and be signed by the President to become law.
Sometimes, Congress passes "special" or "emergency" spending bills. Money for disaster relief, like after a hurricane, might come from these.
The President's budget and Congress's spending bills often have different ideas about what to spend money on. However, the President still has a lot of power through the veto and through allies in Congress.
Budget Authority vs. Actual Spending
The amount of money Congress allows the government to commit to (budget authority) is often different from the amount actually spent (outlays) in a fiscal year. This is because the government can make promises to spend money in future years. For example, a contract that lasts several years.
- Budget authority is the legal permission to make financial promises that will lead to spending government money, either now or later.
- Outlays are the actual payments made, like checks or electronic transfers, to fulfill those promises. This is basically the same as "expenditure" or "spending."
- Appropriations refer to the budget authority to make payments from the Treasury for specific reasons. Some military and housing programs get multi-year appropriations.
In the budget process, an "authorization" law gives a government agency the legal right to do something and sets a limit on how much money can be spent on it. But the agency doesn't get the money until Congress passes an "appropriation" bill. Congress doesn't have to give all the money that was authorized.
Sometimes, Congress can authorize and appropriate money in the same bill. These are called "authorization bills." They are useful for programs where the exact amount of money needed is hard to guess, like certain benefit programs.
Where to Find Budget Information
Several government agencies provide budget information:
- The Government Accountability Office (GAO)
- The Congressional Budget Office (CBO)
- The Office of Management and Budget (OMB)
- The U.S. Treasury Department
The CBO publishes a "Budget and Economic Outlook" in January and updates it in August. The OMB updates the President's budget in July. The GAO and Treasury publish "Financial Statements of the U.S. Government" in December.
Historical tables from the President's Budget (OMB) offer a lot of past data on government finances, going back to 1940.
Future Budget Predictions
The CBO also makes predictions about future revenues, spending, deficits, and debt. Their "Long-term Budget Outlook" shows that debt is expected to rise significantly compared to the size of the economy. This is because the population is getting older, and healthcare costs are growing faster than the economy.
The CBO has calculated how much would need to change to reach certain debt goals. For example, to get the debt down to 41% of GDP by 2048 (its average over the last 50 years), the government would need to cut spending or increase revenues by about 3.0% of GDP each year, starting in 2019. That's about $630 billion in 2019! The longer lawmakers wait to act, the bigger the changes will need to be.
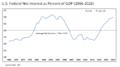
Where the Government Gets Its Money


In the 2018 fiscal year, the federal government collected about $3.33 trillion in taxes. This was a small increase from 2017.
The main sources of money were:
- Individual income taxes: $1.68 trillion (51% of all money collected)
- Social Security/Social Insurance taxes: $1.17 trillion (35%)
- Corporate taxes: $205 billion (6%)
Corporate tax money went down a lot in 2018 because of the Tax Cuts and Jobs Act. In 2018, tax money was 16.4% of GDP, which is a bit lower than the average of 17.4% from 1980-2017.
The economy greatly affects how much tax money the government collects. When the economy slows down (a recession), tax collections usually fall. For example, tax money dropped from $2.5 trillion in 2008 to $2.1 trillion in 2009.
Understanding Tax Policy
Different Types of Taxes
The federal personal income tax is a "progressive" tax. This means people with higher incomes pay a higher percentage of their income in taxes. For example, in 2010, the tax rate for the lowest income bracket was 10%, while the highest income bracket paid 35%. The top tax rate has changed a lot over time. Many people, about 35-40% of U.S. households, don't owe any federal income tax because of various deductions and exemptions.
The federal payroll tax (called FICA) helps pay for Social Security and Medicare. For Social Security, employers and employees each pay 6.2% of a worker's pay, totaling 12.4%. This part of the tax has a cap, meaning income above a certain amount (like $118,500 in 2015) is not taxed for Social Security. The Medicare part is 1.45% for both employer and employee and has no cap. Since 2013, higher earners pay an additional 0.9% in Medicare taxes, making it more progressive overall.
Tax Breaks and Their Impact
"Tax expenditures" are like hidden spending. They are special rules in the tax system (like exclusions, deductions, or lower tax rates) that reduce the amount of money the government collects. These are similar to direct spending because they also add to the federal budget deficit. They also affect how people work, save, and invest.
The CBO estimated that these tax breaks amounted to about $1.5 trillion in 2017. That's roughly half of all the money the government collected and almost three times the size of the budget deficit!
Some of the biggest individual tax breaks in 2013 included:
- Money employers pay for health care and insurance.
- Money put into retirement plans like 401k plans.
- Lower tax rates on certain investments (dividends and capital gains).
- Deductions for state and local taxes.
- Deductions for mortgage interest.
In 2013, the CBO found that more than half of the benefits from 10 major tax breaks went to the wealthiest 20% of households. The top 20% of income earners pay about 70% of federal income taxes (not including payroll taxes).
Where the Government Spends Its Money


In the 2018 fiscal year, the federal government spent $4.11 trillion, which was up 3.2% from 2017. Spending increased in all major areas, mostly for Social Security, interest on the national debt, and defense.
In 2017, the main spending categories were:
- Healthcare (Medicare and Medicaid): $1.08 trillion (27% of all spending)
- Social Security: $939 billion (24%)
- Non-defense discretionary spending: $610 billion (15%)
- Defense Department: $590 billion (15%)
- Interest on the debt: $263 billion (7%)
Spending is divided into two main types:
- Mandatory spending: Payments required by specific laws to people who meet certain rules (like Social Security and Medicare). About two-thirds of federal spending is mandatory.
- Discretionary spending: Amounts that Congress decides on each year as part of the budget process.
The CBO predicts that mandatory spending and interest costs will grow compared to GDP in the coming years, while defense and other discretionary spending will shrink relative to GDP.
Mandatory Spending and Social Safety Nets
Programs like Social Security, Medicare, and Medicaid are considered mandatory spending because their payments are required by law. People who qualify for these programs are legally entitled to benefits. Most people pay taxes into these programs throughout their working lives.
Mandatory spending makes up a large part of the budget (almost 60% of total federal spending). This type of spending is expected to keep growing as a share of GDP. This is partly because more people are retiring, and fewer workers are paying into the system compared to those receiving benefits. For example, in 1960, there were 5.1 workers for every retiree; by 2030, it's expected to be 2.2 workers per retiree. Also, the cost of healthcare per person is rising quickly.
This combination of an aging population and rising costs is expected to cause big deficits for Social Security and Medicare in the future. Unless changes are made, the government might struggle to pay its obligations without risking inflation.
- Medicare: This program helps with healthcare costs for older people and some younger people with disabilities. In 2016, Medicare spending was $692 billion. It's funded by payroll taxes, premiums paid by beneficiaries, and general tax revenues. The number of people in Medicare is expected to grow from 47 million in 2010 to 80 million by 2030. Rising medical prices are a major reason for the projected increase in Medicare spending.
- Social Security: This program provides retirement, survivor, and disability benefits. It's mainly funded by a 12.4% payroll tax. In 2016, Social Security paid out $910 billion in benefits. Since 2010, Social Security's spending has been more than the money it collects from taxes. The program has a "trust fund" from past surpluses, but it's expected to be used up around 2036. After that, under current law, the program would only be able to pay about 75-78% of promised benefits.
Discretionary Spending
- Military Spending: In 2016, the Department of Defense spent $585 billion. This is only part of all defense-related spending, which also includes money for the Department of Veterans Affairs and Homeland Security. The U.S. spends more on its military than the next 13 countries combined.
- Non-Defense Discretionary Spending: This money funds most other government departments and agencies, like the Department of Education or the Environmental Protection Agency. Congress decides these amounts each year. In 2016, the government spent about $600 billion on these areas, which was about 16% of all budgeted spending.
Interest Expense
The government also has to pay interest on its national debt. In 2016, this was about $240 billion. As the U.S. debt grows and interest rates rise, these interest payments are expected to increase significantly. About half of these interest payments now go to foreign owners of U.S. debt.
Deficits and National Debt


What's the Difference Between Deficit and Debt?
The annual budget deficit is the amount the government spends more than it collects in a single year. This amount usually adds to the national debt. However, sometimes there's spending that isn't included in the official deficit calculation but still adds to the debt, like some emergency war funding in the past.
The total federal debt is split into two parts:
- Debt held by the public: This is money the government owes to investors (like people, businesses, or foreign countries) who bought U.S. government bonds.
- Intra-governmental debt: This is money the government owes to its own accounts, like the Social Security trust funds.
As of September 2012, the total debt was $16.1 trillion. The debt held by the public was $11.3 trillion, and intra-governmental debt was $4.8 trillion. The debt held by the public grew from 34.7% of GDP in 2000 to 70.0% in 2012.
Why is Debt a Risk?
The CBO has pointed out several risks if debt levels keep rising:
- More savings might go towards buying government debt instead of investing in new factories or businesses, which could slow down economic growth.
- Rising interest costs could force cuts to important government programs.
- Higher tax rates to pay for the debt could discourage people from working and saving.
- Policymakers might have less flexibility to respond to economic problems.
- There's a risk that investors might demand much higher interest rates, making it even more expensive for the government to borrow.
However, since 2010, the U.S. Treasury has been able to borrow money at very low interest rates. This has helped save taxpayer money.
Current Budget Challenges and Discussions


Different Economic Ideas
Many budget debates come from different ideas about how the economy should work.
- Democrats often support Keynesian economics. This means they believe the government should play a role in the economy, with a mix of private and public businesses, social programs, and strong rules.
- Republicans and Libertarians often support laissez-faire or supply-side economics. They believe in less government involvement, lower taxes, fewer rules, and free markets.
These debates also involve questions about fairness and whether current spending affects future generations. For example, if Congress adds to the debt today, will it make life better or worse for future generations who have to pay it back?
It's hard to make big budget deals because of politics. For example, Republicans might talk about cutting Medicare and Social Security, but they are often unwilling to vote for actual cuts because these programs are popular. Democrats might talk about raising taxes on the wealthy but might hesitate to vote for them.
Trump Tax Cuts
President Trump signed the Tax Cuts and Jobs Act into law in December 2017. The CBO predicted that this law would increase the national debt by about $2.3 trillion over 10 years. This was in addition to the already projected debt increase. The tax cuts reduced taxes for higher-income households.
In 2018, actual tax revenues were $270 billion less than what the CBO had predicted before the tax law was passed. This means the tax cuts led to significantly less money for the government.
Healthcare Reform
The CBO has consistently said that the Patient Protection and Affordable Care Act (also known as "Obamacare") would actually reduce the deficit. This is because its tax increases and future Medicare spending reductions would balance out the new spending for low-income households. The CBO estimated that repealing Obamacare would increase the deficit.
Rising healthcare costs are one of the biggest long-term budget challenges. However, recent predictions show that the long-term budget situation has improved somewhat because healthcare cost increases have slowed down.
U.S. healthcare costs are very high compared to other developed countries. In 2015, they were about $3.2 trillion, or nearly $10,000 per person. Many reasons are given for these high costs, including high administrative costs, more expensive services, and less government control over pricing.
The Great Recession's Impact
After the 2007–2009 U.S. recession, there were big debates about the budget:
- What caused the huge deficit increases? The CBO said it was mainly due to the economic downturn. Tax revenues fell, and spending on social safety net programs (like unemployment benefits) increased as more people needed help.
- Should tax cuts expire? The "Bush tax cuts" from 2001 and 2003 were set to expire. Eventually, they were allowed to expire only for the highest income earners.
- Should the government continue to spend or cut back? While the deficit jumped in 2009, by 2014, it had fallen back to its historical average. This was due to the recovering economy, which brought in more tax money, and some spending cuts.
The COVID-19 pandemic in the United States hit the economy hard in March 2020. Businesses closed, and many people lost their jobs. This meant less tax money for the government and more spending on unemployment benefits and food assistance. Both state and federal budget deficits were expected to grow a lot.
To help, Congress passed the Coronavirus Aid, Relief, and Economic Security Act (CARES) in March 2020. This law included loans and grants for businesses, direct payments to individuals, and more money for unemployment insurance. The CBO estimated that the CARES Act would increase federal deficits by about $1.8 trillion over 10 years.
The Committee for a Responsible Federal Budget estimated that the budget deficit for fiscal year 2020 would reach a record $3.8 trillion, or 18.7% of GDP. For comparison, the deficit in 2009 during the Great Recession was $1.4 trillion (9.8% of GDP).
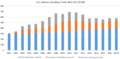
How Much the Government Has Spent Recently

.png)


Here are the total spending amounts from recent U.S. federal budgets:
- 2024 United States federal budget – $6.9 trillion (proposed by President Biden)
- 2023 United States federal budget – $6.1 trillion (proposed by President Biden)
- 2022 United States federal budget – $6.3 trillion (proposed by President Biden)
- 2021 United States federal budget – $6.8 trillion (proposed by President Trump)
- 2020 United States federal budget – $6.5 trillion (proposed by President Trump)
- 2019 United States federal budget – $4.4 trillion (proposed by President Trump)
- 2018 United States federal budget – $4.1 trillion (proposed by President Trump)
- 2017 United States federal budget – $4.2 trillion (proposed by President Obama)
- 2016 United States federal budget – $4.0 trillion (proposed by President Obama)
- 2015 United States federal budget – $3.9 trillion (proposed by President Obama)
- 2014 United States federal budget – $3.5 trillion (proposed by President Obama)
- 2013 United States federal budget – $3.8 trillion (proposed by President Obama)
- 2012 United States federal budget – $3.7 trillion (proposed by President Obama)
- 2011 United States federal budget – $3.8 trillion (proposed by President Obama)
- 2010 United States federal budget – $3.6 trillion (proposed by President Obama)
- 2009 United States federal budget – $3.5 trillion (proposed by President Bush)
- 2008 United States federal budget – $2.9 trillion (proposed by President Bush)
- 2007 United States federal budget – $2.8 trillion (proposed by President Bush)
- 2006 United States federal budget – $2.7 trillion (proposed by President Bush)
- 2005 United States federal budget – $2.4 trillion (proposed by President Bush)
- 2004 United States federal budget – $2.3 trillion (proposed by President Bush)
- 2003 United States federal budget – $2.2 trillion (proposed by President Bush)
- 2002 United States federal budget – $2.0 trillion (proposed by President Bush)
- 2001 United States federal budget – $1.9 trillion (proposed by President Clinton)
- 2000 United States federal budget – $1.8 trillion (proposed by President Clinton)
- 1999 United States federal budget – $1.7 trillion (proposed by President Clinton)
- 1998 United States federal budget – $1.7 trillion (proposed by President Clinton)
- 1997 United States federal budget – $1.6 trillion (proposed by President Clinton)
- 1996 United States federal budget – $1.6 trillion (proposed by President Clinton)
The budget year runs from October 1st to September 30th of the next year. The President sends the budget to Congress before October for the next year. So, the 2001 budget was proposed by Bill Clinton but was in effect for most of George W. Bush's first year. Similarly, the 2009 budget was proposed by George W. Bush but was in effect for most of Barack Obama's first year.
The President's budget also includes predictions for current and future years. The CBO also releases its own budget and economic outlooks.
Historical Spending and Revenue
This table shows the history of annual spending and revenue for the U.S. federal government.
1989
| Year | Revenues (million $) |
Outlays (million $) |
Deficit (million $) |
Deficit (in % of GDP) |
|---|---|---|---|---|
| 1789–1849 (total) | 1,160 | 1,090 | 70 | |
| 1850–1900 (total) | 14,462 | 15,453 | −991 | |
| 1901 | 588 | 525 | 63 | |
| 1902 | 562 | 485 | 77 | |
| 1903 | 562 | 517 | 45 | |
| 1904 | 541 | 584 | −43 | |
| 1905 | 544 | 567 | −23 | |
| 1906 | 595 | 570 | 25 | |
| 1907 | 666 | 579 | 87 | |
| 1908 | 602 | 659 | −57 | |
| 1909 | 604 | 694 | −89 | |
| 1910 | 676 | 694 | −18 | |
| 1911 | 702 | 691 | 11 | |
| 1912 | 693 | 690 | 3 | |
| 1913 | 714 | 715 | −1 | |
| 1914 | 725 | 726 | −1 | |
| 1915 | 683 | 746 | −63 | |
| 1916 | 761 | 713 | 48 | |
| 1917 | 1,101 | 1,954 | −853 | |
| 1918 | 3,645 | 12,677 | −9,032 | |
| 1919 | 5,130 | 18,493 | −13,363 | |
| 1920 | 6,649 | 6,358 | 291 | |
| 1921 | 5,571 | 5,062 | 509 | |
| 1922 | 4,026 | 3,289 | 736 | |
| 1923 | 3,853 | 3,140 | 713 | |
| 1924 | 3,871 | 2,908 | 963 | |
| 1925 | 3,641 | 2,924 | 717 | |
| 1926 | 3,795 | 2,930 | 865 | |
| 1927 | 4,013 | 2,857 | 1,155 | |
| 1928 | 3,900 | 2,961 | 939 | |
| 1929 | 3,862 | 3,127 | 734 | |
| 1930 | 4,058 | 3,320 | 738 | 0.8% |
| 1931 | 3,116 | 3,577 | −462 | −0.5% |
| 1932 | 1,924 | 4,659 | −2,735 | −4.0% |
| 1933 | 1,997 | 4,598 | −2,602 | −4.5% |
| 1934 | 2,955 | 6,541 | −3,586 | −5.8% |
| 1935 | 3,609 | 6,412 | −2,803 | −4.0% |
| 1936 | 3,923 | 8,228 | −4,304 | −5.4% |
| 1937 | 5,387 | 7,580 | −2,193 | −2.5% |
| 1938 | 6,751 | 6,840 | −89 | −0.1% |
| 1939 | 6,295 | 9,141 | −2,846 | −3.1% |
| 1940 | 6,548 | 9,468 | −2,920 | −3.0% |
| 1941 | 8,712 | 13,653 | −4,941 | −4.3% |
| 1942 | 14,634 | 35,137 | −20,503 | −13.9% |
| 1943 | 24,001 | 78,555 | −54,554 | −29.6% |
| 1944 | 43,747 | 91,304 | −47,557 | −22.2% |
| 1945 | 45,159 | 92,712 | −47,553 | −21.0% |
| 1946 | 39,296 | 55,232 | −15,936 | −7.0% |
| 1947 | 38,514 | 34,496 | 4,018 | 1.7% |
| 1948 | 41,560 | 29,764 | 11,796 | 4.5% |
| 1949 | 39,415 | 38,835 | 580 | 0.2% |
| 1950 | 39,443 | 42,562 | −3,119 | −1.1% |
| 1951 | 51,616 | 45,514 | 6,102 | 1.9% |
| 1952 | 66,167 | 67,686 | −1,519 | −0.4% |
| 1953 | 69,608 | 76,101 | −6,493 | −1.7% |
| 1954 | 69,701 | 70,855 | −1,154 | −0.3% |
| 1955 | 65,451 | 68,444 | −2,993 | −0.7% |
| 1956 | 74,587 | 70,640 | 3,947 | 0.9% |
| 1957 | 79,990 | 76,578 | 3,412 | 0.7% |
| 1958 | 79,636 | 82,405 | −2,769 | −0.6% |
| 1959 | 79,249 | 92,098 | −12,849 | −2.5% |
| 1960 | 92,492 | 92,191 | 301 | 0.1% |
| 1961 | 94,388 | 97,723 | −3,335 | −0.6% |
| 1962 | 99,676 | 106,821 | −7,146 | −1.2% |
| 1963 | 106,560 | 111,316 | −4,756 | −0.8% |
| 1964 | 112,613 | 118,528 | −5,915 | −0.9% |
| 1965 | 116,817 | 118,228 | −1,411 | −0.2% |
| 1966 | 130,835 | 134,532 | −3,698 | −0.5% |
| 1967 | 148,822 | 157,464 | −8,643 | −1.0% |
| 1968 | 152,973 | 178,134 | −25,161 | −2.8% |
| 1969 | 186,882 | 183,640 | 3,242 | 0.3% |
| 1970 | 192,807 | 195,649 | −2,842 | −0.3% |
| 1971 | 187,139 | 210,172 | −23,033 | −2.1% |
| 1972 | 207,309 | 230,681 | −23,373 | −1.9% |
| 1973 | 230,799 | 245,707 | −14,908 | −1.1% |
| 1974 | 263,224 | 269,359 | −6,135 | −0.4% |
| 1975 | 279,090 | 332,332 | −53,242 | −3.3% |
| 1976 | 298,060 | 371,792 | −73,732 | −3.1% |
| 1977 | 355,559 | 409,218 | −53,659 | −2.6% |
| 1978 | 399,561 | 458,746 | −59,185 | −2.6% |
| 1979 | 463,302 | 504,028 | −40,726 | −1.6% |
| 1980 | 517,112 | 590,941 | −73,830 | −2.6% |
| 1981 | 599,272 | 678,241 | −78,968 | −2.5% |
| 1982 | 617,766 | 745,743 | −127,977 | −3.9% |
| 1983 | 600,562 | 808,364 | −207,802 | −5.9% |
| 1984 | 666,438 | 851,805 | −185,367 | −4.7% |
| 1985 | 734,037 | 946,344 | −212,308 | −5.0% |
| 1986 | 769,155 | 990,382 | −221,227 | −4.9% |
| 1987 | 854,287 | 1,004,017 | −149,730 | −3.1% |
| 1988 | 909,238 | 1,064,416 | −155,178 | −3.0% |
| 991,104 | 1,143,743 | −152,639 | −2.7% | |
| 1990 | 1,031,958 | 1,252,993 | −221,036 | −3.7% |
| 1991 | 1,054,988 | 1,324,226 | −269,238 | −4.4% |
| 1992 | 1,091,208 | 1,381,529 | −290,321 | −4.5% |
| 1993 | 1,154,334 | 1,409,386 | −255,051 | −3.8% |
| 1994 | 1,258,566 | 1,461,752 | −203,186 | −2.8% |
| 1995 | 1,351,790 | 1,515,742 | −163,952 | −2.2% |
| 1996 | 1,453,053 | 1,560,484 | −107,431 | −1.3% |
| 1997 | 1,579,232 | 1,601,116 | −21,884 | −0.3% |
| 1998 | 1,721,728 | 1,652,458 | 69,270 | 0.8% |
| 1999 | 1,827,452 | 1,701,842 | 125,610 | 1.3% |
| 2000 | 2,025,191 | 1,788,950 | 236,241 | 2.3% |
| 2001 | 1,991,082 | 1,862,846 | 128,236 | 1.2% |
| 2002 | 1,853,136 | 2,010,894 | −157,758 | −1.5% |
| 2003 | 1,782,314 | 2,159,899 | −377,585 | −3.3% |
| 2004 | 1,880,114 | 2,292,841 | −412,727 | −3.4% |
| 2005 | 2,153,611 | 2,471,957 | −318,346 | −2.5% |
| 2006 | 2,406,869 | 2,655,050 | −248,181 | −1.8% |
| 2007 | 2,567,985 | 2,728,686 | −160,701 | −1.1% |
| 2008 | 2,523,991 | 2,982,544 | −458,553 | −3.1% |
| 2009 | 2,104,989 | 3,517,677 | −1,412,688 | −9.8% |
| 2010 | 2,162,706 | 3,457,079 | −1,294,373 | −8.7% |
| 2011 | 2,303,466 | 3,603,065 | −1,299,599 | −8.5% |
| 2012 | 2,449,990 | 3,536,945 | −1,086,955 | −6.8% |
| 2013 | 2,775,106 | 3,454,648 | −679,542 | −4.1% |
| 2014 | 3,021,491 | 3,506,091 | −484,600 | −2.8% |
| 2015 | 3,249,887 | 3,688,383 | −438,496 | −2.4% |
| 2016 | 3,267,961 | 3,852,612 | −584,651 | −3.3% |
| 2017 | 3,316,182 | 3,981,554 | −665,372 | −3.7% |
| 2018 | 3,329,907 | 4,109,047 | −779,140 | −3.9% |
| 2019 | 3,463,364 | 4,446,960 | −983,596 | −4.7% |
| 2020 | 3,421,164 | 6,553,621 | −3,132,457 | −14.9% |
| 2021 | 4,047,111 | 6,822,470 | −2,775,359 | −12.0% |
| 2022 | 4,897,399 | 6,273,324 | −1,375,925 | −5.4% |
Images for kids
-
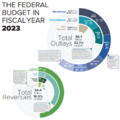
CBO: U.S. Federal spending and revenue components for fiscal year 2023. Major expenditure categories are healthcare, Social Security, and defense; income and payroll taxes are the primary revenue sources.
-
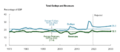
CBO: Revenue and Expense as % GDP. Deficits are projected to grow as a percentage of GDP as the country ages and healthcare costs rise faster than the economy.
-

CBO current law baseline as of May 2023, showing forecast of deficit and debt by year
-
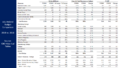
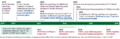
Table compares US federal spending and revenue in 2019 vs. 2018 using CBO historical data.
-
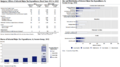
CBO charts describing about $1.0 trillion in tax expenditures during 2013 (i.e., exemptions, deductions, and preferential rates) and their distribution across income groups. The top 20% of income earners received 50% of the benefit from these tax breaks; they also pay approximately 70% of federal income taxes.
-
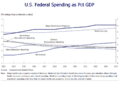
CBO projections of U.S. Federal spending as % GDP 2014-2024
-
A timeline showing projected debt milestones from the CBO
-
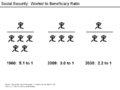
Social Security – Ratio of Covered Workers to Retirees. Over time, there will be fewer workers per retiree.
-
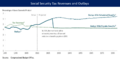
CBO forecast of Social Security tax revenues and outlays from 2015 to 2085. Under current law, the outlays are projected to exceed revenues, requiring a 29% reduction in program payments starting around 2030 once the Social Security Trust Fund is exhausted.
-
Defense Spending 2001–2017
-
Interest to GDP, a measure of debt burden, was very low in 2015 but is projected to rise with both interest rates and debt levels over the 2016-2026 period.
-
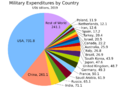
A pie chart showing global military expenditures by country for 2019, in US$ billions, according to SIPRI
-
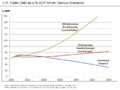
2010 Report of the National Commission on Fiscal Responsibility and Reform-Public Debt as % GDP Under Various Scenarios
-
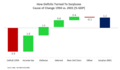
Waterfall chart shows cause of change from deficit in 1994 to surplus in 2001, measured as a % GDP. Income tax revenues rose as a % GDP following higher taxes for high income earners, while defense spending and interest fell relative to GDP.
-
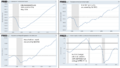
Several major U.S. economic variables had recovered from the 2007-2009 Subprime mortgage crisis and Great Recession by the 2013-2014 time period.


