
Image: Changes in aragonite saturation of the world's oceans, 1880-2012 (US EPA)
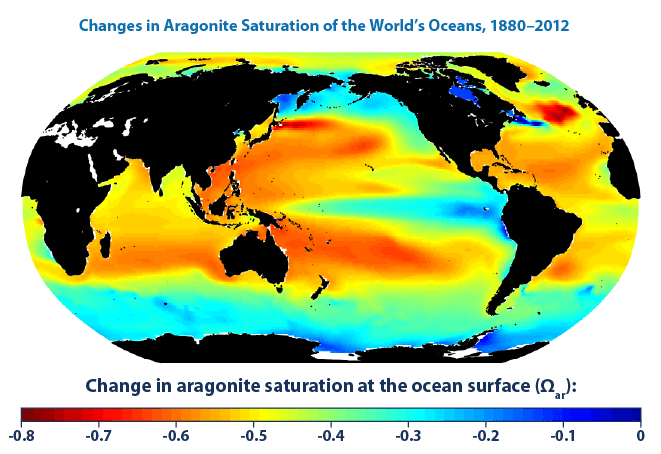
Description: This map shows changes in the amount of aragonite dissolved in ocean surface waters between the 1880s and the most recent decade (2003-2012). Aragonite is a form of calcium carbonate that many marine animals use to build their skeletons and seashells. Aragonite saturation is a ratio that compares the amount of aragonite that is actually present with the total amount of aragonite that the water could hold if it were completely saturated. The more negative the change in aragonite saturation, the larger the decrease in aragonite available in the water, and the harder it is for marine creatures to produce their skeletons and shells. Measurements made over the last few decades have demonstrated that ocean carbon dioxide levels have risen in response to increased carbon dioxide in the atmosphere, leading to an increase in acidity (that is, a decrease in pH). Historical modeling suggests that since the 1880s, increased carbon dioxide has led to lower aragonite saturation levels (less availability of minerals) in the oceans around the world. The largest decreases in aragonite saturation have occurred in tropical waters. However, decreases in cold areas may be of greater concern because colder waters typically have lower aragonite levels to begin with. Details The global map shows changes over time in the amount of aragonite dissolved in ocean water, which is called aragonite saturation. This map was created by comparing average conditions during the 1880s with average conditions during the most recent 10 years (2003-2012). Aragonite saturation has only been measured at selected locations during the last few decades, but it can be calculated reliably for different times and locations based on the relationships scientists have observed among aragonite saturation, pH, dissolved carbon, water temperature, concentrations of carbon dioxide in the atmosphere, and other factors that can be measured. Thus, while Figure 2 was created using a computer model, it is indirectly based on actual measurements. The map was created by the National Oceanic and Atmospheric Administration and the Woods Hole Oceanographic Institution using Community Earth System Model data. Related information can be found at: [1]. This image description is based on the US EPA (2012) public-domain source. References Feely, R.A., S.C. Doney, and S.R. Cooley (2009), “Ocean acidification: Present conditions and future changes in a high-CO2 world”, in Oceanography[2], volume 22, issue 4, pages 36–47, DOI (Data source). Free download from Woods Hole Open Access Server (PDF).
Title: Changes in aragonite saturation of the world's oceans, 1880-2012 (US EPA)
Credit: Climate Change Indicators in the United States, 2012, 2nd ed: Ocean Acidity: Figure 2. Changes in Aragonite Saturation of the World's Oceans, 1880-2012[3], US Environmental Protection Agency (EPA), (Please provide a date or year)
Author: US EPA
Permission: Public domain status confirmed by e-mail
Usage Terms: Public domain
License: Public domain
Attribution Required?: No
Image usage
The following 2 pages link to this image:

.png)