
Image: Distribution of Cones and Rods on Human Retina
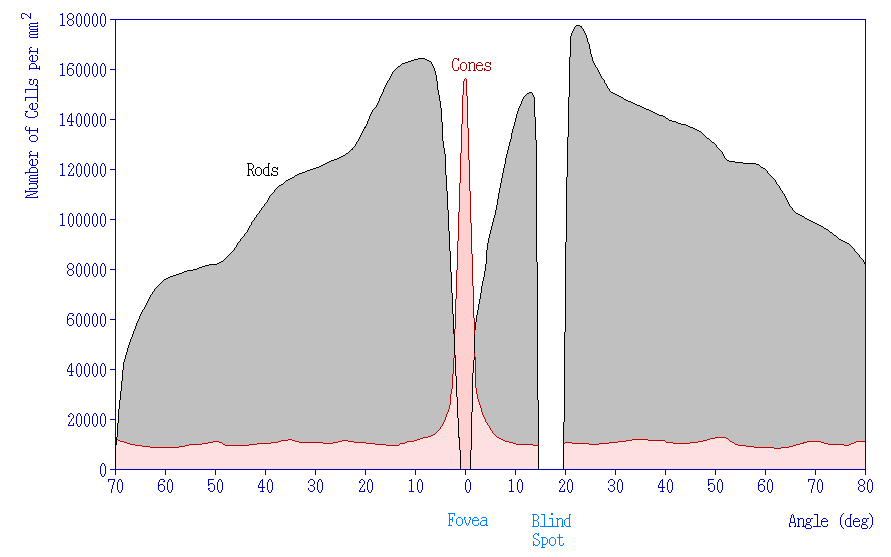
Description: Shows the density of cone and rod cells for a horizontal slice through a human left eye (through fovea and blind spot), depending on the distance (angle in degrees) from the fovea center. Data taken from p.104 of the book "Allgemeine Psychologie - Eine Einführung" (General Psychology - An Introduction), C. Becker-Carus 2011, Springer. - Meanwhile, I recommend to use the File:Human photoreceptor distribution.svg instead, which conveys the same information, but looks nicer, and is a vector graphic; JB.
Title: Distribution of Cones and Rods on Human Retina
Credit: Own work
Author: Jochen Burghardt
Usage Terms: Creative Commons Attribution-Share Alike 3.0
License: CC BY-SA 3.0
License Link: https://creativecommons.org/licenses/by-sa/3.0
Attribution Required?: Yes
Image usage
The following page links to this image:
