
Image: Earth's heating rate since 2005
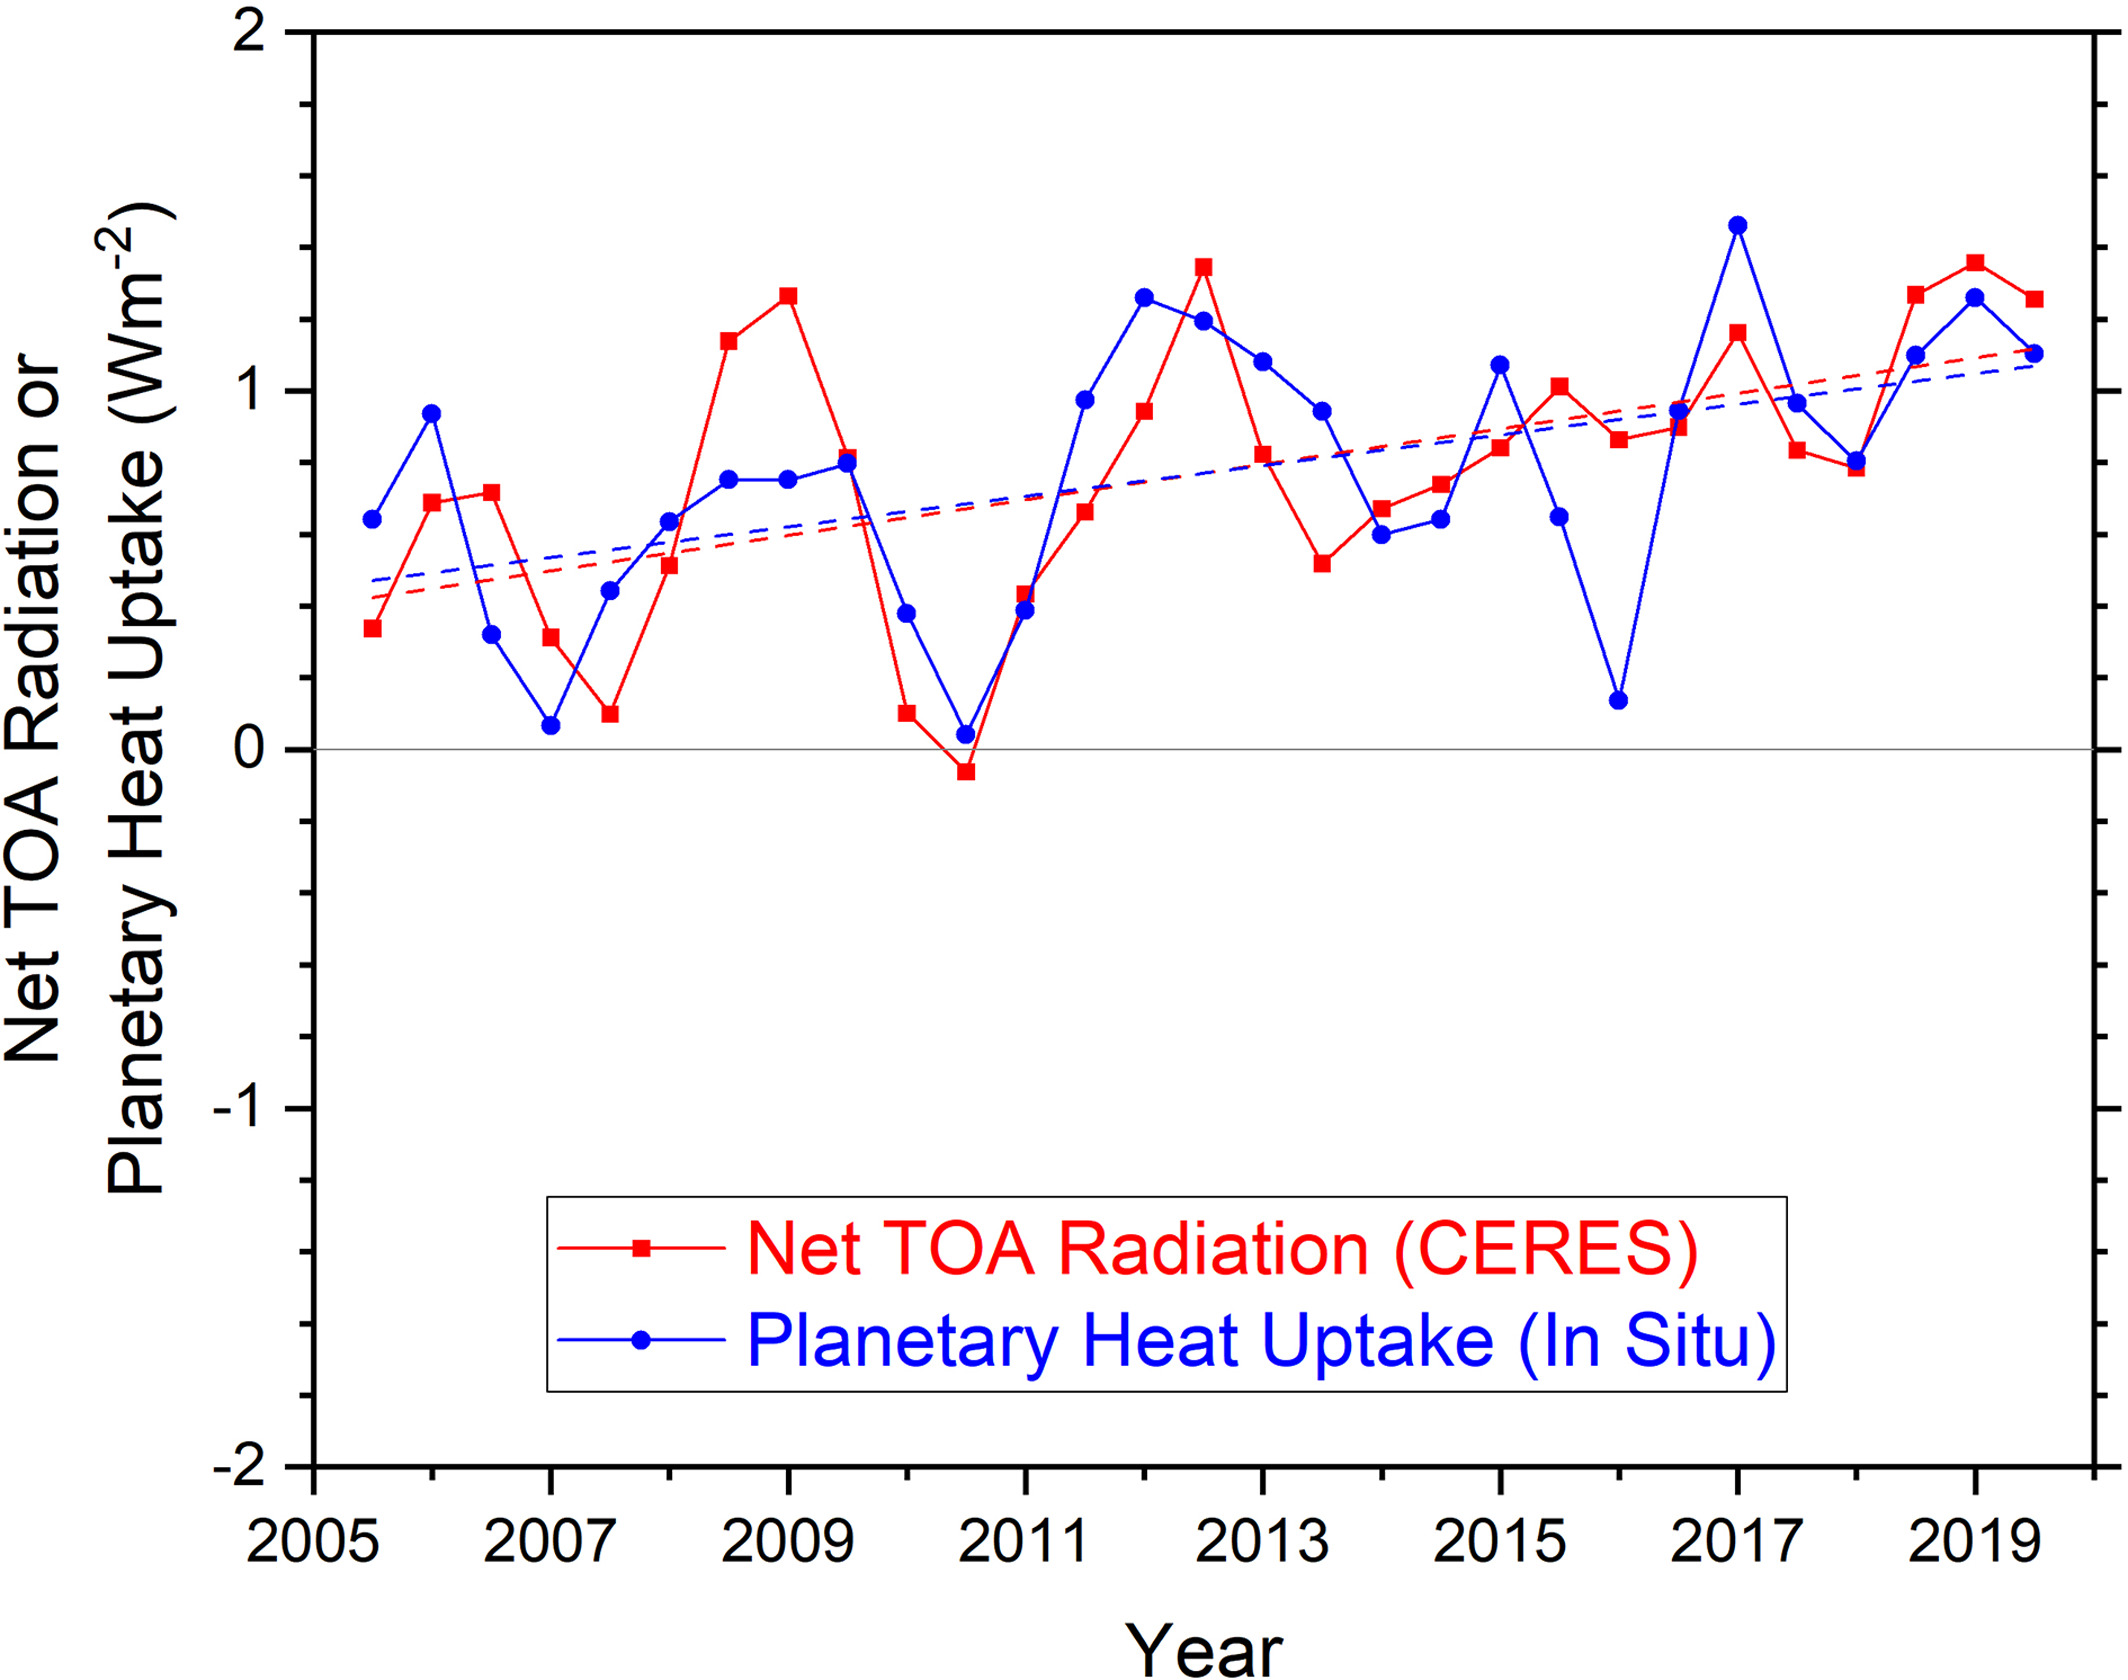
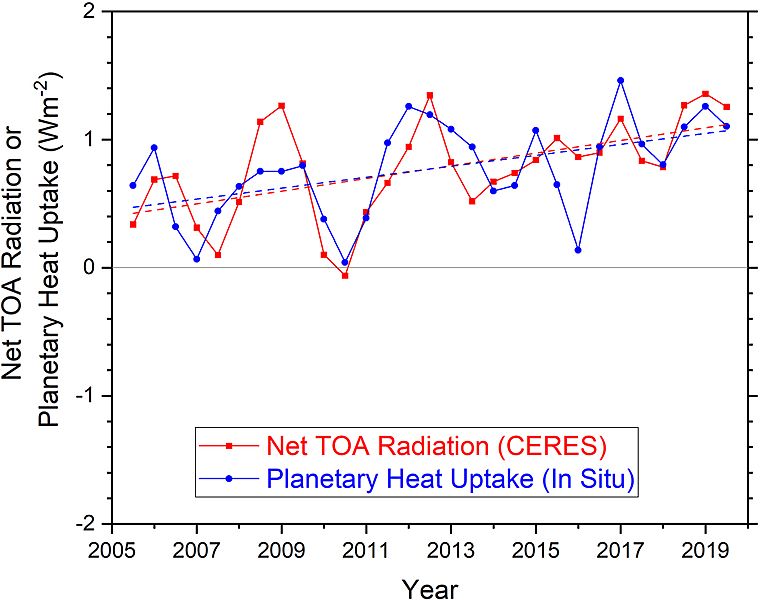
Description: This graph shows shows the growth in Earth's rate of warming from year 2005 to 2019 as a comparison of data from two diverse and independent measurement sets. CERES (satellite) data representing the radiation imbalance at top of atmosphere (TOA) are shown in red. Rates of heat uptake calculated from Argo (in-situ) measurements of the planet's rising ocean temperatures are shown in blue. Data points are overlapping one-year estimates at six-month intervals. The linear trend of each data set is also shown as a corresponding dotted line. Discussion of measurement uncertainties and significance is provided in the source publication and here. Credit: Loeb, Norman G.; Johnson, Gregory C.; Thorsen, Tyler J.; Lyman, John M.; Rose, Fred G.; and Kato, Seiji (15 June 2021). "Satellite and Ocean Data Reveal Marked Increase in Earth's Heating Rate". Geophysical Research Letters. 48 (13). Bibcode:2021GeoRL..4893047L. doi:10.1029/2021GL093047.
Title: Earth's heating rate since 2005
Credit: https://agupubs.onlinelibrary.wiley.com/doi/10.1029/2021GL093047
Author: Loeb, Norman G.; Johnson, Gregory C.; Thorsen, Tyler J.; Lyman, John M.; Rose, Fred G.; and Kato, Seiji
Usage Terms: Creative Commons Attribution 4.0
License: CC BY 4.0
License Link: https://creativecommons.org/licenses/by/4.0
Attribution Required?: Yes
Image usage
The following page links to this image:
