
Image: Final 2008 electoral cartogram
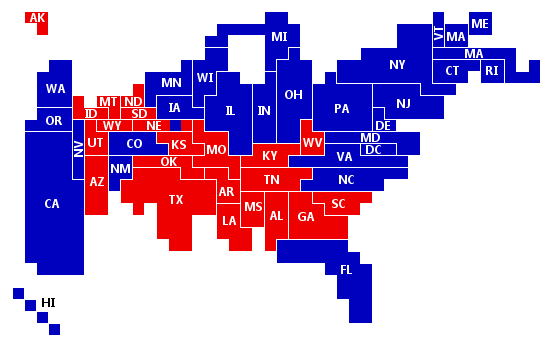
Description: Final 2008 electoral college cartogram. Blue squares represent electoral votes for Obama-Biden. Red squares represent electoral votes for McCain-Palin. Note that this cartogram is topologically correct in that any two states which touch in reality touch on this cartogram. The cartogram has been published in J.R. Gott and W.N. Colley's 2008 paper, "Median Statistics in Polling" in Mathematical and Computer Modeling.
Title: Final 2008 electoral cartogram
Credit: No machine-readable source provided. Own work assumed (based on copyright claims).
Author: No machine-readable author provided. Wes colley assumed (based on copyright claims).
Usage Terms: Creative Commons Attribution-Share Alike 3.0
License: CC BY-SA 3.0
License Link: https://creativecommons.org/licenses/by-sa/3.0
Attribution Required?: Yes
Image usage
The following page links to this image:
