
Infographic facts for kids

Infographics are cool pictures that show information, facts, or ideas in a quick and clear way. The word "infographic" comes from "information" and "graphics." They help you understand things better by using visuals like charts, maps, and drawings. This makes it easier for your brain to spot patterns and trends.
Infographics are a lot like other ways of showing data, such as information visualization or data visualization. But infographics are often made for everyone to understand, not just experts. This means they don't assume you know a lot about the topic already.
Contents
What are Infographics?
Infographics have been around for a long time. But lately, it's become much easier to make them with free online tools. Because of this, lots of people can now create their own infographics. Social media sites like Facebook and Twitter also help infographics spread quickly around the world. They are super useful today because people often have short attention spans.
You often see infographics in newspapers. They show things like the weather, maps, or summaries of information. Some books are almost entirely made of infographics, like The Way Things Work by David Macaulay. The "Snapshots" in USA Today are also simple infographics that share news.
Modern maps, especially for public transport like the Washington Metro or the London Underground, use infographic tricks. They combine lots of information, like where the train lines go, where you can switch trains, and important places nearby. Public places often have signs with simple pictures and maps to help you find your way.
Basically, infographics take a lot of information and make it easy to understand and remember. They help you quickly grasp big ideas.
The History of Infographics
Infographics have a rich history, showing how people have always wanted to share information visually.
Early Infographics
In 1626, a scientist named Christoph Scheiner used drawings in his book to show how the sun rotates. These were early examples of infographics.
Later, in 1786, William Playfair, an engineer, published the first data graphs. He used bar charts, line graphs, and area charts to show how the economy of 18th Century England was doing. He also invented the first pie chart.
Around 1820, Carl Ritter helped create modern geography. His maps used clear symbols and scales, making them easy to understand. These maps combined different ways of showing information.

In 1857, a famous nurse named Florence Nightingale used infographics to convince Queen Victoria to make hospitals better for soldiers. She used a special chart called a Coxcomb chart to show how many soldiers died each month during the Crimean War and why.

One of the most famous infographics was made in 1861 by Charles Joseph Minard. It showed Napoleon's terrible march on Moscow. This single image showed four things at once: where the army went, how many soldiers died from hunger and wounds, and how cold it got. It perfectly showed why Napoleon's army failed.
In 1878, James Joseph Sylvester used the word "graph" for the first time in a science magazine. He published diagrams that showed how chemical bonds worked, which were some of the first mathematical graphs.
Infographics in the 20th Century
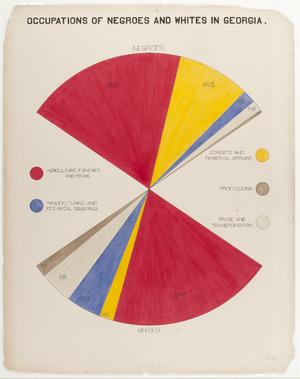
In 1900, W.E.B. Du Bois, an African-American historian and activist, showed amazing data visualizations at a big exhibition in Paris. He and his team created 60 handmade charts to show how Black Americans were treated unfairly in education, housing, and jobs.
From 1926 to 1934, a group in Vienna developed the Vienna Method. They used simple pictures to show data in a clear way. This method later became known as Isotypes. The goal was to make information easy for everyone to understand, no matter their language.
In 1972 and 1973, the Pioneer 10 and Pioneer 11 spacecraft carried special plaques into space. These plaques had pictures designed by Carl Sagan and Frank Drake. The images were meant to be understood by aliens, who wouldn't know human languages.
Edward Tufte, a leader in data visualization, wrote several important books about infographics. He is sometimes called the "da Vinci of Data." Tufte believes that good data visuals show every piece of information accurately and help you see trends easily. His ideas are used in many websites, magazines, and newspapers today.
The infographics made by Peter Sullivan for The Sunday Times in the 1970s to 1990s helped newspapers use more visuals. Also, the newspaper USA Today, which started in 1982, aimed to use graphics to make news easier to understand. However, some people criticized them for making news too simple or focusing too much on entertainment. Tufte even created the term chartjunk for graphics that look pretty but don't share information well.
As computer graphics became common, infographics started appearing in many computer programs, like those for publishing and maps.
Infographics Today (21st Century)
Around the year 2000, animations on the internet, often made with Adobe Flash, started using infographic ideas for games and other products.
Television also began using infographics in the early 2000s. For example, the music video for "Remind Me" by Röyksopp was made entirely of animated infographics. These videos showed how powerful infographics could be for explaining complex things.
Now, with new technologies like HTML 5, infographics are made with many different software tools.
Even journalism uses infographics in news stories. Newsrooms often work together using a system called the maestro concept to combine text, images, and graphics. This helps them present stories better for busy readers. Many news websites now have interactive infographics where you can click to learn more.
Businesses use infographics to talk to customers and get their attention. They are a type of content marketing that helps companies share information and improve their online presence.
Even religious groups use infographics to teach people about their faith and activities.
Infographics are also popular in classrooms. When students create their own infographics, it can make learning more fun and help them understand topics better.
Thanks to social media, infographics are everywhere! They are often simple pictures or web pages that cover all sorts of topics. People share them a lot on sites like Facebook, Twitter, and Pinterest.
Data Visualization in Infographics

Data visualization is a big part of infographics. It means showing data in a visual way. There are many ways to show the same information, so it's important to pick the right visual for your data. You need to think about things like position, size, shape, and color. There are five main types of data visualizations: time-series, statistical, maps, hierarchies, and networks.
Time-Series Data
Time-series data shows how values change over time. Think of a graph that tracks your height as you grow each year.
- Index charts are good for showing how things change over time, like stock prices. They focus on how much something has grown or shrunk, not just the exact number.
- Stacked graphs are like area charts piled on top of each other. They show overall patterns and individual parts at the same time.
- Small multiples show each data set separately, making it easier to see individual trends.
- Horizon graphs are a clever way to pack a lot of time-series data into a small space without losing detail.
Statistical Data

Statistical visualizations show how numbers are spread out. They help you see trends in data.
- Histograms and box-and-whisker plots are common. They show things like the average, middle value, and unusual numbers in a group of data.
- Stem-and-leaf plots are useful for looking at how often numbers appear in a collection.
- Q–Q plots compare two sets of data to see if they are similar.
- Scatter plot matrices (SPLOM) show how many different variables relate to each other using multiple scatter plots.
- Parallel coordinates plot data on parallel lines, connecting points to show relationships between many variables at once.
Maps in Infographics

Maps are perfect for showing data related to places.
- Flow maps use lines of different widths and colors to show movement or connections over time and space, like migration patterns.
- Choropleth maps use different colors to show data across different regions, like population density.
- Graduated symbol maps use symbols (like pie charts) on a map. The size or color of the symbol changes based on the data for that area.
- Cartograms change the shape of regions on a map to show data. For example, a country might look bigger or smaller depending on its population, not its actual land size.
Hierarchies in Infographics

Many types of data, like how a government is structured or how a company is organized, can be shown as hierarchies (like a family tree).
- Node-link diagrams are like trees, where each main idea branches off into smaller parts. They are neat and save space.
- Adjacency diagrams fill space with solid areas, showing sub-sections inside bigger sections. This makes it easy to see the size of each part.
- Enclosure diagrams also fill space but use containers to show the hierarchy. Like adjacency diagrams, they make it easy to see the size of each node.
Network Infographics


Network visualizations explore relationships, like friendships or connections between people.
- Force-directed layouts are common. They treat nodes (people or things) like magnets that push away from each other, while links (relationships) pull related nodes together.
- Arc diagrams show nodes in a line with curved lines connecting them. If the nodes are ordered well, you can easily spot groups or bridges between them.
- Matrix views are often used by mathematicians. They show relationships in a grid, using colors instead of lines. This avoids messy line crossings in big networks.
Many modern infographics combine several of these visualization types with illustrations and text. Some infographics don't even have data visuals; they just present information in a colorful and clear way.
Comparison Infographics
Comparison infographics are visuals that focus on showing how different things are alike and different. This could be products, services, or features. They help you make smart choices by showing information clearly and simply. They are great for making complex data easy to understand and highlighting the main differences between items.
Tools for Making Infographics
You can make infographics by hand using simple things like graph paper, pencils, and rulers. But today, most people use computer software because it's faster and easier.
There are many software programs you can download or use online to create diagrams. Some even have templates to help you start. Plus, some tools let you work with others on the same diagram in real time over the internet.
There are also special tools for making very specific types of visuals. For example, you can create an infographic from the data in your smartphone photos, or make a visual resume, or even a "picture of your digital life."
See also
 In Spanish: Infografía para niños
- A picture is worth a thousand words
- Argument map
- Charts
- Digital dashboard
- Data Presentation Architecture
- Data visualization
- Edugraphic
- Graphic design
- Graphic image development
- Graphic organizers
- Information design
- List of information graphics software
- Scientific visualization
- Statistical graphics
- Technical illustration
- Isotype (picture language)
- Timeline
- Visualization (graphic)
- News Illustrated
- Maestro Concept
- Family tree
