
Chart facts for kids

A chart, also known as a graph, is a visual way to show information or "data." Instead of just looking at lots of numbers, charts use symbols like bars, lines, or slices to make the data easier to understand. They can show numbers, how things change over time, or even how different things are connected.
Charts are super helpful because they make big amounts of information much simpler to see and understand quickly. It's often faster to look at a chart than to read through all the raw numbers. People use charts in many different areas, from science to business. You can draw them by hand on special paper (called graph paper) or use computer programs to create them. Different types of charts work best for different kinds of information. For example, if you want to show parts of a whole, like percentages (e.g., how many people are "satisfied" or "not satisfied"), a pie chart is often used. But if you want to see how numbers change over time (like how much money a company made each year), a line chart is usually the best choice.
What Makes a Chart Work?
Charts can look very different from each other, but they all have common parts that help us understand the information they show.
Most of the time, the information in a chart is shown with pictures because our brains can understand pictures faster than just text. Text is usually used to add notes or explain things on the chart.
One of the most important parts of a chart is its title. The title usually sits at the top of the chart. It gives a short and clear description of what the chart is about and what information it's showing.
The actual information on a chart can be shown in many ways. It might have individual text labels that describe specific points or sections on the chart. The data can appear as dots, shapes, or lines, and they can be different colors or patterns. Sometimes, important points or interesting findings are even drawn right onto the chart to help you notice them.
If a chart shows information about several different things at once, it will often have a legend (which is also called a key). A legend is a list that explains what each symbol, color, or pattern on the chart means. This helps you tell apart the different types of information being shown.
Different Kinds of Charts
There are many types of charts, each good for showing different kinds of information:
- A bar chart uses rectangular bars to compare values for different groups or categories. The longer the bar, the larger the value.
- A pie chart looks like a circle (a pie) cut into slices. Each slice shows a percentage of a whole, so you can easily see how much each part contributes to the total.
- A flow chart uses shapes and arrows to show the steps in a process or how different parts of a system connect. It helps you understand a sequence of actions.
Images for kids
-
Timeline chart
-
Sunburst Chart
-
Waterfall chart
-
Tree map
-
GapChart
-
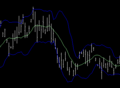
Open-high-low-close chart
-
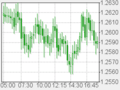
Candlestick chart
-
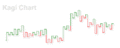
Kagi chart
-
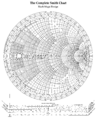
Smith chart
-
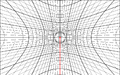
Greninger chart
-
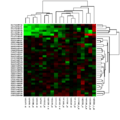
Heatmap
-
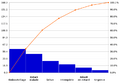
Pareto chart
-
Run chart
-
Strip chart
-
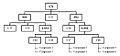
Structure chart
-

Dot plot (statistics)
-
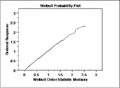
Probability plot
-
Biplot


.png)


See also
 In Spanish: Gráfica para niños
