
Gantt chart facts for kids

A Gantt chart is a special kind of bar chart. It's a helpful tool used in project management. This means it helps people plan and keep track of big projects. An engineer named Henry L. Gantt invented these charts in the 1910s.
The main purpose of a Gantt chart is to show a project's schedule. It clearly displays when each part of a project will start and finish. Imagine you're building a treehouse. A Gantt chart would show when you'll gather wood, when you'll build the frame, and when you'll add the roof.
Gantt charts also show "dependencies" between tasks. This means some tasks can only begin after another task is completely finished. For example, you can't paint the treehouse until you've built the walls! Other tasks can happen at the same time, like one person cutting wood while another person gathers tools.
These charts can even show how much of a task is already done. They might use shading to show progress. A vertical line can also show "TODAY" to help you see if the project is on track.
When they were first created, Gantt charts were a big deal! They made planning much easier. Today, they are very common. People also use them in information technology to organize different kinds of data.
Images for kids
-
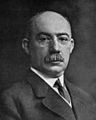
Henry Gantt, the person who invented the Gantt chart.
-
A Gantt chart made with Microsoft Project. Notice that the most important path (the critical path) is shown in red. The black lines show "slack," which is extra time for tasks that aren't on the critical path. Also, some bars are longer because they go through weekends, which are not work days.

See also
 In Spanish: Diagrama de Gantt para niños
