
Image: Foreclosure Trend
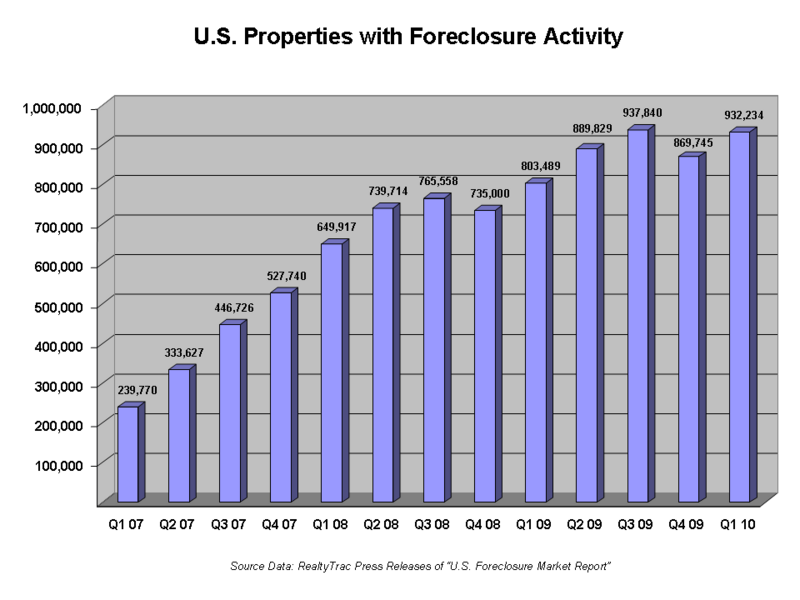
Description: U.S. Household Property Foreclosure Chart 2007 This data was publicly disclosed by RealtyTrac through press releases available on their website, some of which are cited in the 2007 Subprime Mortgage Financial Crisis article directly. I created the table from this data. Q1 10: 932,234 = Q1 RealtyTrac release, a 7% increase from the previous quarter and 16% versus Q1 2009 Q4 09: 869,745 = Q4 RealtyTrac release - "...foreclosure activity in the fourth quarter decreased 7 percent from the third quarter, although it was still up 18 percent from the fourth quarter of 2008." This is the average of these two figures. Q3 09: 937,840 = Q3 RealtyTrac release - Up 29% vs. year earlier period Q2 09: 889,829 = Q2 RealtyTrac release Q1 09: 803,489 = Q1 RealtyTrac release Q4 08: 735,000 = Q4 RealtyTrac release said foreclosure activity down "nearly" 4% from prior quarter. This is rounded. Q3 08: 765,558 = Cited on CNN [1] Q2 08: Q1 08: 649,917 = Directly cited in their Q1 press release. Q4 07: 527,740 = Stated in year-end press release [2] Q3 07: 446,726 = Stated in Q3 press release [3] Q2 07: 333,627 = Q3 number was stated as a 33.9% increase on Q2 number in table of press release. Q1 07: 239,770 = Half year report cited 573,397 properties; less Q2 number above. Note that Q1-Q4 2007 adds to 1,547,863, not the 1,285,873 RealtyTrac cited for full year. The following is an explanation from RealtyTrac: "The reason for the numbers not adding up is that we run the reports for the year-end separately; we don’t just add up all the quarters. Because of the way the report is designed, it only counts each property once during the entire year even if the property has multiple filings against it during the timeframe used for the report. So when we run it for the entire year, the number will be lower than adding up all the quarters because there will be some properties that appeared in multiple quarters because they had foreclosure activity against them in more than one quarter." RealtyTrac includes default notices, auction sale notices and bank repossessions in its reporting and can include multiple filings on the same property. The number of total notices was 2.2 million for 2007, as cited in the year-end press release.
Title: Foreclosure Trend
Credit: self-made from public data
Author: Farcaster (talk)
Usage Terms: Creative Commons Attribution-Share Alike 3.0
License: CC BY-SA 3.0
License Link: http://creativecommons.org/licenses/by-sa/3.0/
Attribution Required?: Yes
Image usage
The following page links to this image:
