
Image: Geothermal.Electricity.NZ.Ohaaki
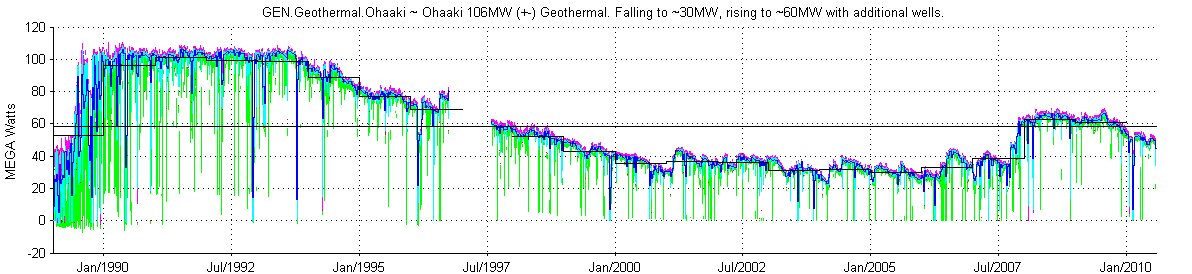
Description: Generation at the Ohaaki geothermal power station, half-hourly figures grouped daily and plotted as magenta (max-upper quartile), green (min-lower quartile), red (median), pale blue (daily average) stepwise dark blue (weekly average), black step (annual averages), black line (overall average). The gap starting in October 1996 is a consequence of data being lost after a change in computer systems.
Title: Geothermal.Electricity.NZ.Ohaaki
Credit: Data via the N.Z. Electricity Commission collection and Gnash, plotted via MatLab Transferred from en.wikipedia by Ronhjones
Author: NickyMcLean at en.wikipedia
Usage Terms: Creative Commons Attribution 3.0
License: CC BY 3.0
License Link: http://creativecommons.org/licenses/by/3.0
Attribution Required?: Yes
Image usage
The following 2 pages link to this image:
