
Image: Gini Index US Counties 2010

Size of this preview: 800 × 591 pixels. Other resolutions: 320 × 236 pixels | 1,835 × 1,355 pixels.
Original image (1,835 × 1,355 pixels, file size: 818 KB, MIME type: image/jpeg)
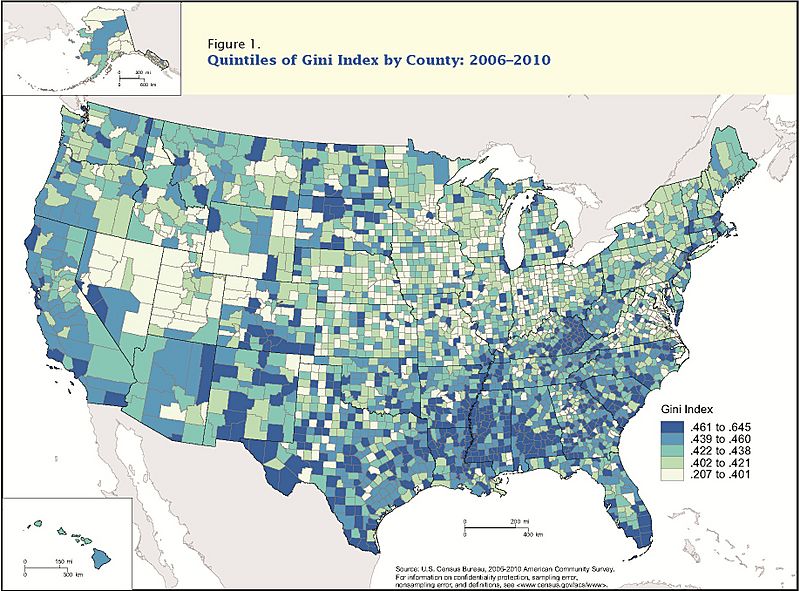
Description: This map shows the Gini Index distribution by County for 2006-2010. According to US Census Bureau, the map illustrates each county’s level of income inequality, as measured by the Gini index. The 5-year 2006–2010 Gini index for the United States as a whole was 0.467. County-level Gini indexes ranged from 0.645 to 0.207. For the full report, see: http://www.census.gov/newsroom/releases/archives/income_wealth/cb12-tps11.html
Title: Gini Index US Counties 2010
Credit: US Census Bureau (U.S. Department of Commerce)
Author: Adam Bee
Usage Terms: Public domain
License: Public domain
Attribution Required?: No
Image usage
The following page links to this image:

All content from Kiddle encyclopedia articles (including the article images and facts) can be freely used under Attribution-ShareAlike license, unless stated otherwise.