
Image: Global Temperature Anomaly

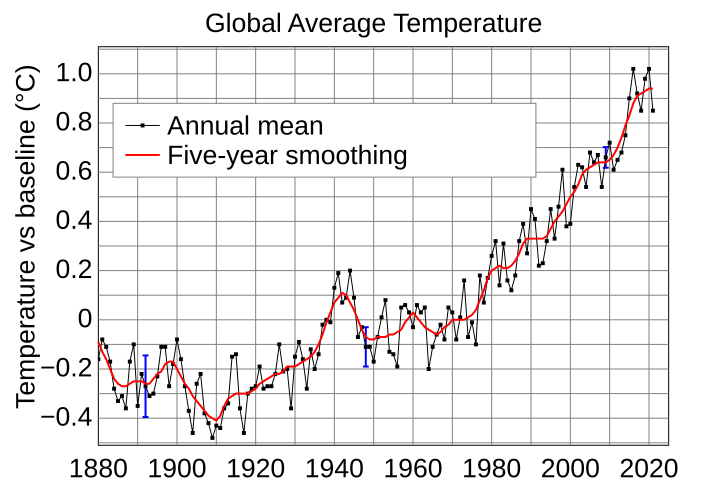
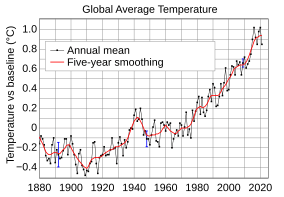
Description: Land-ocean temperature index, 1880 to present, with base period 1951-1980. The solid black line is the global annual mean and the solid red line is the five-year lowess smooth, i.e. a non-parametric regression analysis that relies on a k-nearest-neighbor model. The function is evaluated using a fraction of data corresponding to a ten year window of data, giving an effective smoothing of approximately five years. The blue uncertainty bars (95% confidence limit) account only for incomplete spatial sampling. This is based upon Fig. 1A in Hansen et al. (2006) and Fig. 9a in Hansen et al. (2010). The graph shows an overall long-term warming trend.
Title: Global Temperature Anomaly
Credit: http://data.giss.nasa.gov/gistemp/graphs/
Author: NASA Goddard Institute for Space Studies
Usage Terms: Public domain
License: Public domain
Attribution Required?: No
Image usage
The following page links to this image:
