
Image: Greenland ice sheet temperatures Vinther et al 2009
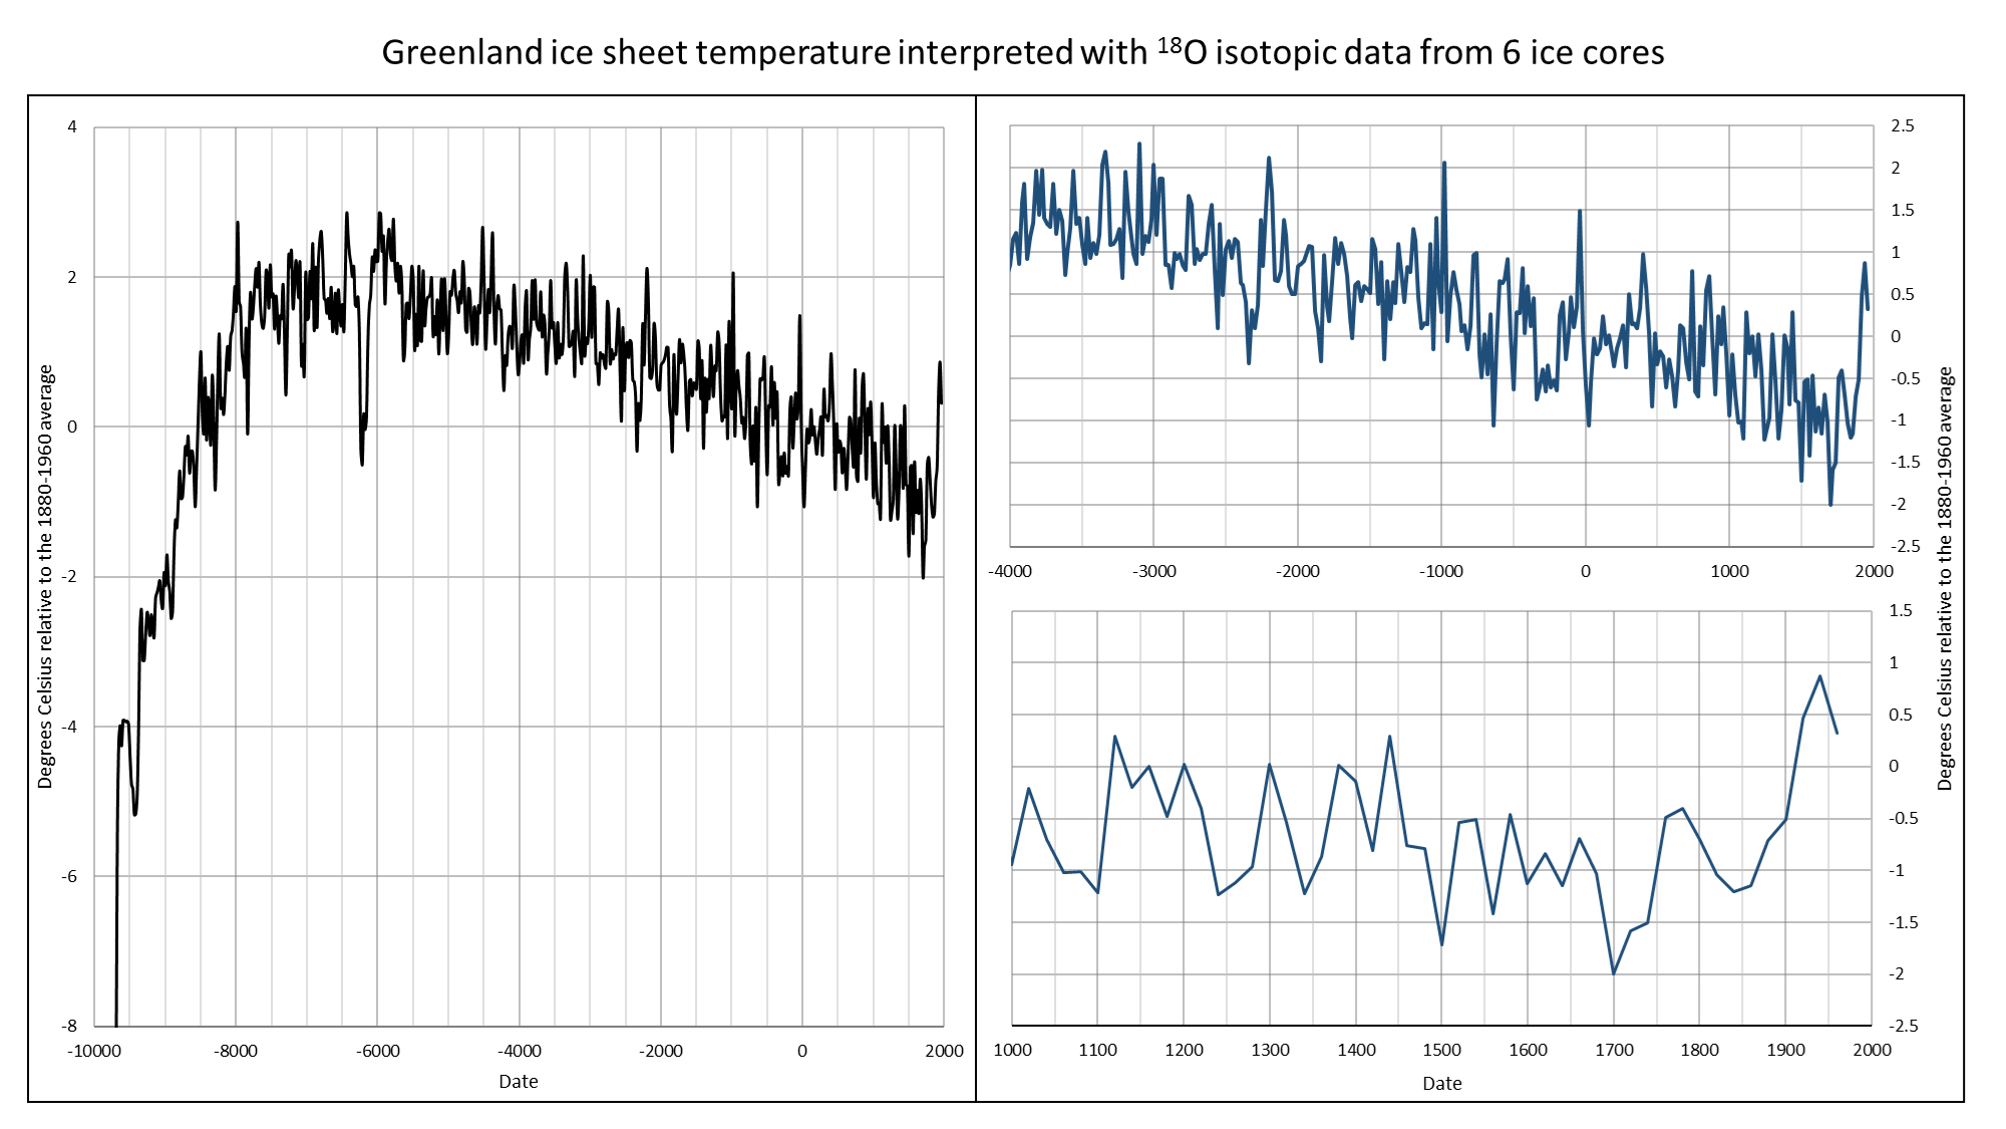
Description: The temperature reconstruction produced using data from all six ice cores is shown by the black line in the attached figure, and spans the period from 9690BC to AD1970. The blue lines represent two focus on the dataset, first on the Late Holocene (or Meghalayan) and then on the last millenium. It has a resolution of around 20 years, meaning that each data point represents the average temperature of the surrounding 20 years. So, the end of the record – 1970 – shows the average temperature between 1960 and 1980. The original data for the creation of these figures have been downloaded from the NOAA website: ftp://ftp.ncdc.noaa.gov/pub/data/paleo/icecore/greenland/vinther2009greenland.txt ORIGINAL REFERENCE: Vinther, B.M., S.L. Buchardt, H.B. Clausen, D. Dahl-Jensen, S.J. Johnsen, D.A. Fisher, R.M. Koerner, D. Raynaud, V. Lipenkov, K.K. Andersen, T. Blunier, S.O. Rasmussen, J.P. Steffensen, and A.M. Svensson. 2009. Holocene thinning of the Greenland ice sheet. Nature, Vol. 461, pp. 385-388, 17 September 2009. doi:10.1038/nature08355 SEE ALSO: Factcheck: What Greenland ice cores say about past and present climate change https://www.carbonbrief.org/factcheck-what-greenland-ice-cores-say-about-past-and-present-climate-change
Title: Greenland ice sheet temperatures Vinther et al 2009
Credit: Own work
Author: Ambactos55
Usage Terms: Creative Commons Attribution 4.0
License: CC BY 4.0
License Link: https://creativecommons.org/licenses/by/4.0
Attribution Required?: Yes
Image usage
The following page links to this image:
