
Image: Growth rate map of municipalities of Tokyo Metropolis, Japan

Size of this PNG preview of this SVG file: 703 × 599 pixels. Other resolution: 282 × 240 pixels.
Original image (SVG file, nominally 800 × 682 pixels, file size: 35 KB)
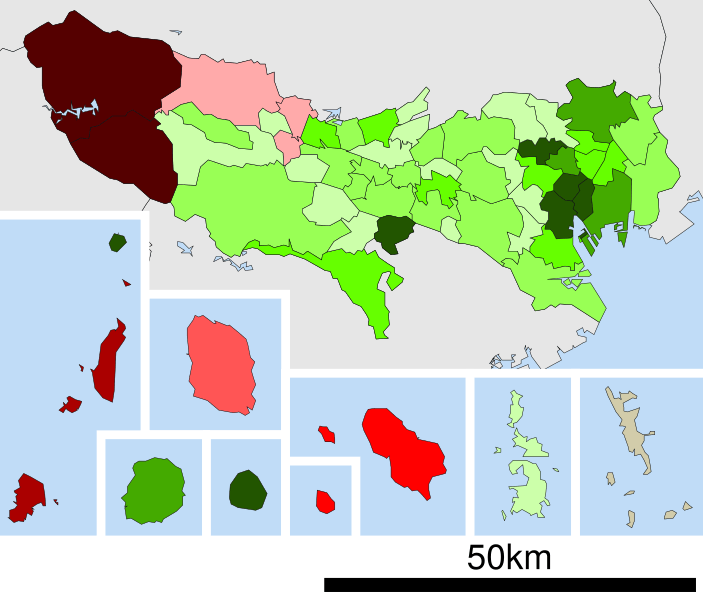
Description: This chart is growth rate of municipalities of Tokyo Metropolis, Japan.It is estimated by census carried out in 2005 and 2010. Increase
10.0 % and over
7.5 - 9.99 %
5.0 - 7.49 %
2.5 - 4.99 %
0.0 - 2.49 % Decrease
0.0 - 2.49 %
2.5 - 4.99 %
5.0 - 7.49 %
7.5 - 9.99 %
10.0 % and below
Author: User:Ow00wo
Usage Terms: Creative Commons Attribution-Share Alike 3.0
License: CC-BY-SA-3.0
License Link: http://creativecommons.org/licenses/by-sa/3.0/
Attribution Required?: Yes
Image usage
The following page links to this image:

All content from Kiddle encyclopedia articles (including the article images and facts) can be freely used under Attribution-ShareAlike license, unless stated otherwise.