
Image: Logistic-sigmoid-vs-scaled-probit

Size of this PNG preview of this SVG file: 600 × 600 pixels. Other resolution: 240 × 240 pixels.
Original image (SVG file, nominally 630 × 630 pixels, file size: 133 KB)
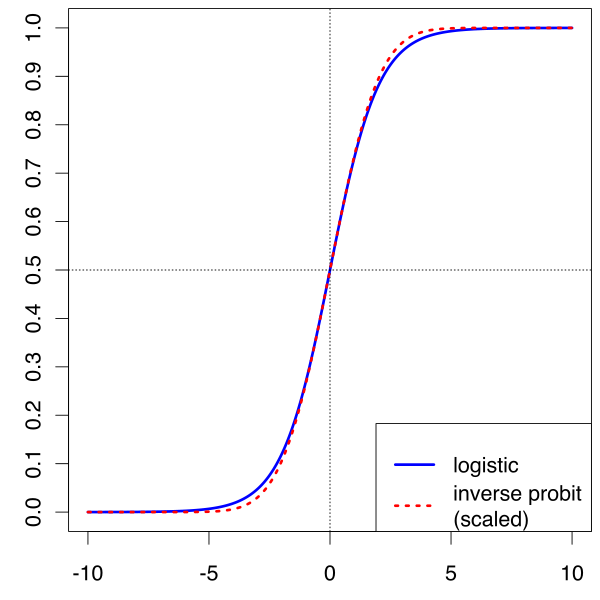
Description: Comparison of logistic sigmoid and scaled probit (scaling = sqrt(pi/8)). Created using the following R code: Source Code x=-100:100/10 svg("logistic-probit.svg") par(cex=1.5,mai=c(0.8,0.8,0.1,0.1)) plot(x,plogis(x),type="l",xlab="", ylab="",lwd=2) points(x,pnorm(sqrt(pi/8)*x),type="l",lty=3,col="red",lwd=2) legend("bottomright", c("logistic", "inverse probit\n(scaled)"), col = c("black","red"), lty=c(1,3),lwd=2) dev.off()
Title: Logistic-sigmoid-vs-scaled-probit
Credit: Created using R
Author: Benwing
Usage Terms: Creative Commons Attribution-Share Alike 3.0
License: CC BY-SA 3.0
License Link: https://creativecommons.org/licenses/by-sa/3.0
Attribution Required?: Yes
Image usage
The following page links to this image:

All content from Kiddle encyclopedia articles (including the article images and facts) can be freely used under Attribution-ShareAlike license, unless stated otherwise.