
Image: M2 and Inflation USA

Size of this PNG preview of this SVG file: 662 × 481 pixels. Other resolution: 320 × 233 pixels.
Original image (SVG file, nominally 662 × 481 pixels, file size: 21 KB)
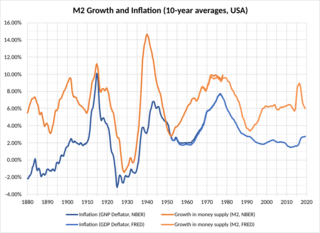
Description: Graph showing inflation (GNP/GDP deflator) and the growth of money supply (M2) in the United States.The graph can be reproduced by producing a 10-year moving average for each series, and comparing (by division) resulting values that are one year apart.
Usage Terms: Public domain
Image usage
The following page links to this image:

All content from Kiddle encyclopedia articles (including the article images and facts) can be freely used under Attribution-ShareAlike license, unless stated otherwise.