
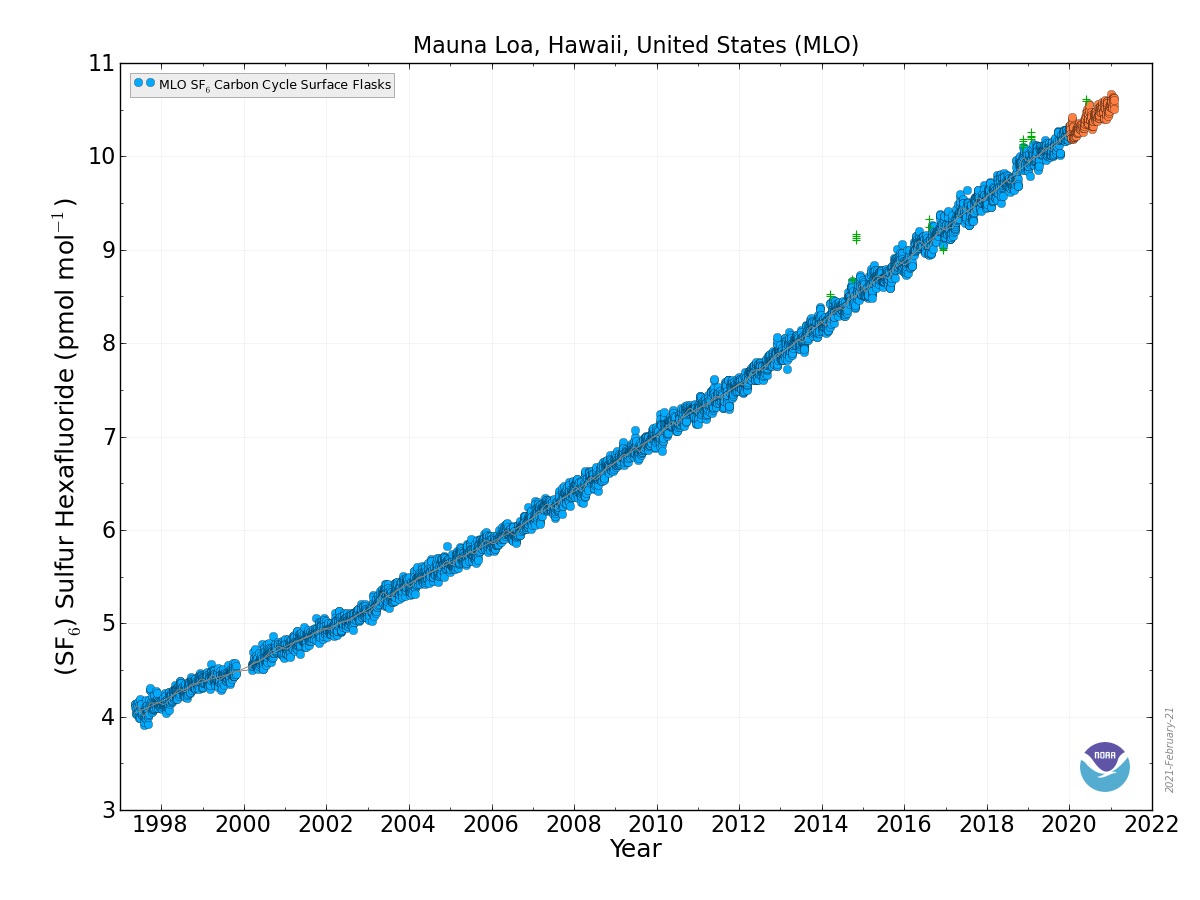
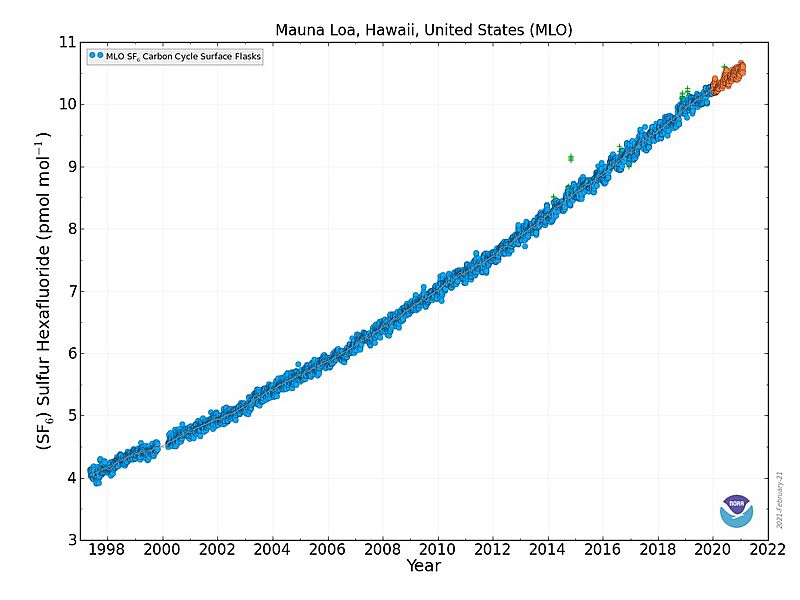
Image: Mauna Loa Sulfur Hexafluoride concentration 1998-2020
Description: Graph shows the concentration of sulfur hexafluoride (SF6) in earth's atmosphere versus time. X-axis data interval is weekly, starting May 1997. Y-axis concentration is picamole per mole (parts per trillion). Atmospheric samples were gathered within evacuated flasks from the Mauna Loa Observatory Hawaii, then sealed and transported to Boulder Colorado for analysis. Similar observations gathered from other remote sampling sites around the world validate that these data represent a well-mixed gas throughout the atmosphere.
Title: Mauna Loa Sulfur Hexafluoride concentration 1998-2020
Credit: https://www.esrl.noaa.gov/gmd/dv/iadv/graph.php?code=MLO&program=ccgg&type=ts
Author: NOAA
Usage Terms: Public domain
License: Public domain
Attribution Required?: No
Image usage
The following page links to this image:
