
Image: Mpumalanga dominant language map
Size of this PNG preview of this SVG file: 617 × 599 pixels. Other resolution: 247 × 240 pixels.
Original image (SVG file, nominally 1,015 × 986 pixels, file size: 1.14 MB)
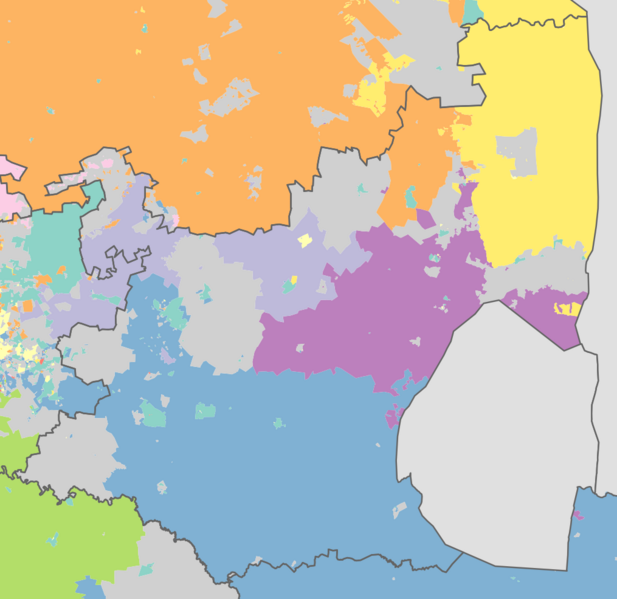
Description: Map showing the dominant home languages in Mpumalanga province of South Africa, according to Census 2001 at the "Subplace" level. In this context, a language is dominant if it more than 50% of the population in an area speak it at home, or more than 33% speak it and no other language is spoken by more than 25%. Afrikaans English isiNdebele isiXhosa isiZulu Sesotho sa Leboa Setswana siSwati Xitsonga No language dominant
Usage Terms: Public domain
Image usage
The following page links to this image:

All content from Kiddle encyclopedia articles (including the article images and facts) can be freely used under Attribution-ShareAlike license, unless stated otherwise.