
Image: Percentage graph UK POLITICS 2005
No higher resolution available.
Percentage_graph_UK_POLITICS_2005.png (652 × 533 pixels, file size: 38 KB, MIME type: image/png)
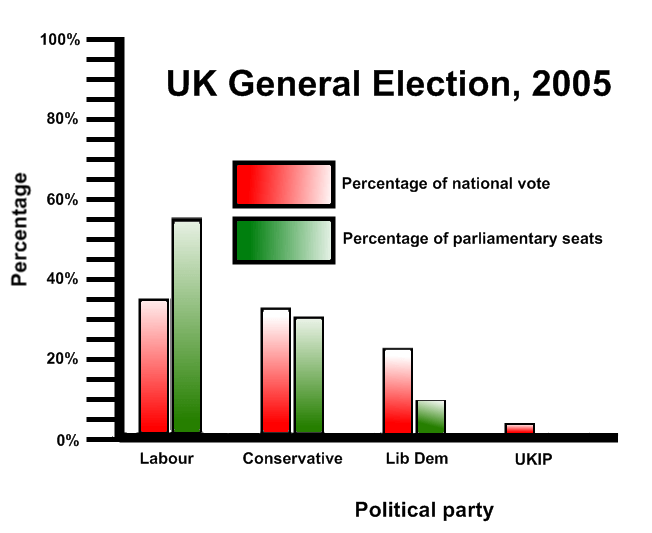
Description: Graph showing the difference between the popular vote and percentage of seats gained for the major parties in the 2005 United Kingdom General Election
Title: Percentage graph UK POLITICS 2005
Credit: I created this work entirely by myself.
Author: Joebloggsy (talk)
Usage Terms: Creative Commons Attribution-Share Alike 3.0
License: CC BY-SA 3.0
License Link: http://creativecommons.org/licenses/by-sa/3.0
Attribution Required?: Yes
Image usage
The following page links to this image:

All content from Kiddle encyclopedia articles (including the article images and facts) can be freely used under Attribution-ShareAlike license, unless stated otherwise.