
Image: Pollchart-tpp-event

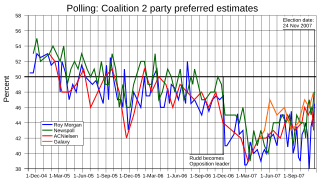
Description: Chart of Australian two party preferred polling between the 2004 federal election and the 2007 federal election by w:en:Newspoll (as published in w:en:News Limited's w:en:The Australian), w:en:ACNielsen (as published in Fairfax's Sydney Morning Herald and w:en:The Age), w:en:Roy Morgan Research, and w:en:Galaxy Research. Roy Morgan polls 800-1000 eligible voters face to face, while the others poll 1200-1700 eligible voters over the phone. Polling is conducted nation-wide. The declared margin of error for polling is +/- 3 percent. The two party preferred (2PP) system works by distributing preferences of smaller parties, wiped out in the w:en:instant-runoff voting process, to establish ultimately which major party the voter will choose - Labor or Coalition (Liberal or National). A coalition result of 51 percent would mean a Labor result of 49 percent, or vice versa. Whichever party polls the higher two-party preferred figure at the election would hold the majority of lower house seats to form government - exceptions to this since 2PP was introduced in 1949 were in 1954 (49.3), 1961 (49.5), 1969 (49.8), 1990 (49.90), and 1998 (49.02). 1940 was estimated to be won on 49.7 percent. Votes have only been fully distributed since the 1983 federal election, previous to this, limited distributions occurred to achieve an estimated two-party preferred result. The largest two-party preferred election result for the w:en:Liberal Party of Australia was at the 1966 federal election on 56.9 percent, while the largest two-party preferred election result for the w:en:Australian Labor Party was at the 1983 federal election on 53.23 percent (the largest unofficial result was 58.2 percent for Labor at the 1943 federal election, estimated by w:en:Malcolm Mackerras[2]). The last polls from each company for Labor on two party preferred terms was Galaxy 52, Newspoll 52, Roy Morgan 53.5, ACNielsen 57. See Also Newspoll polling 1996 v 2007 Newspoll polling 1993 - 2007 ACNielsen polling 1996 - 2007 Roy Morgan polling 1996 - 2007 Galaxy polling 2004 - 2007
Title: Pollchart-tpp-event
Credit: Transferred from en.wikipedia to Commons.
Author: Original uploader was JPD at en.wikipedia
Permission: CC-BY-SA-3.0,2.5,2.0,1.0; Released under the w:en:GNU Free Documentation License.
Usage Terms: Creative Commons Attribution-Share Alike 3.0
License: CC BY-SA 3.0
License Link: https://creativecommons.org/licenses/by-sa/3.0
Attribution Required?: Yes
Image usage
The following page links to this image:
