
Image: Pop continents 2000 2050
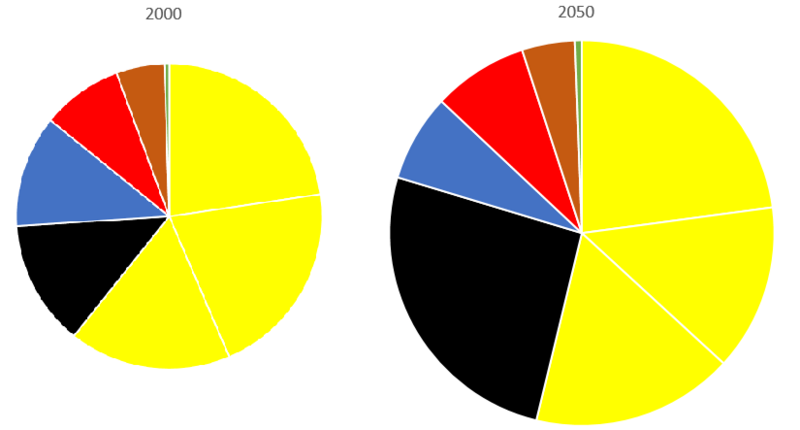
Description: UN population estimates by continent for 2000 and 2050. Data from UN World Population Prospects 2017. Projections for 2050 are the "median" estimates of the 2017 edition of UN World Population Prospects. color code selected for consistency with File:World population (UN).svg: yellow: Asia, black: Africa, blue: Europe, red: South+Central America + Caribbean, brown: North America, green: Oceania. The two pie chart sizes are to scale (area ratio 1.60, diameter ratio 1.26) Data for Asia is shown divided into three sections, Asia (other), China, India, to represent China and India separately as the two most populous countries. Data (population in millions): 2000: World: 6144, Asia (other): 1394 [23%], China: 1283 [21%], India: 1054 [17%], Africa: 817 [13%], Europe: 727 [12%], South America: 526 [8.6%], North America: 313 [5.1%], Oceania: 31 [0.5%]. 2050: World: 9771 (+60%), Asia (other): 2234 [23%] (+60%), China: 1364 [14%] (+6%), India: 1659 [17%] (+57%), Africa: 2528 [26%] (+209%), Europe: 715 [7.3%] (-1.7%), South America: 780 [8.0%] (+48%), North America: 434 [4.4%] (+39%), Oceania: 57 [0.6%] (+84%). Average population growth is projected as +60%, or 0.94% p.a. on average. Growth is driven by the disproportionate growth of African population (+209%, 2.3% p.a.), offset by the near-stagnation in China (+6%, 0.1% p.a.) and in Europe (-1.7%, -0.03% p.a.).
Title: Pop continents 2000 2050
Credit: self made (source of data: see description)
Author: Own work
Usage Terms: Creative Commons Attribution-Share Alike 4.0
License: CC BY-SA 4.0
License Link: https://creativecommons.org/licenses/by-sa/4.0
Attribution Required?: Yes
Image usage
The following page links to this image:
