
Image: Property Price Changes Across South African Metros, 2010 Through 2024
Size of this preview: 800 × 382 pixels. Other resolutions: 320 × 153 pixels | 3,600 × 1,721 pixels.
Original image (3,600 × 1,721 pixels, file size: 112 KB, MIME type: image/png)
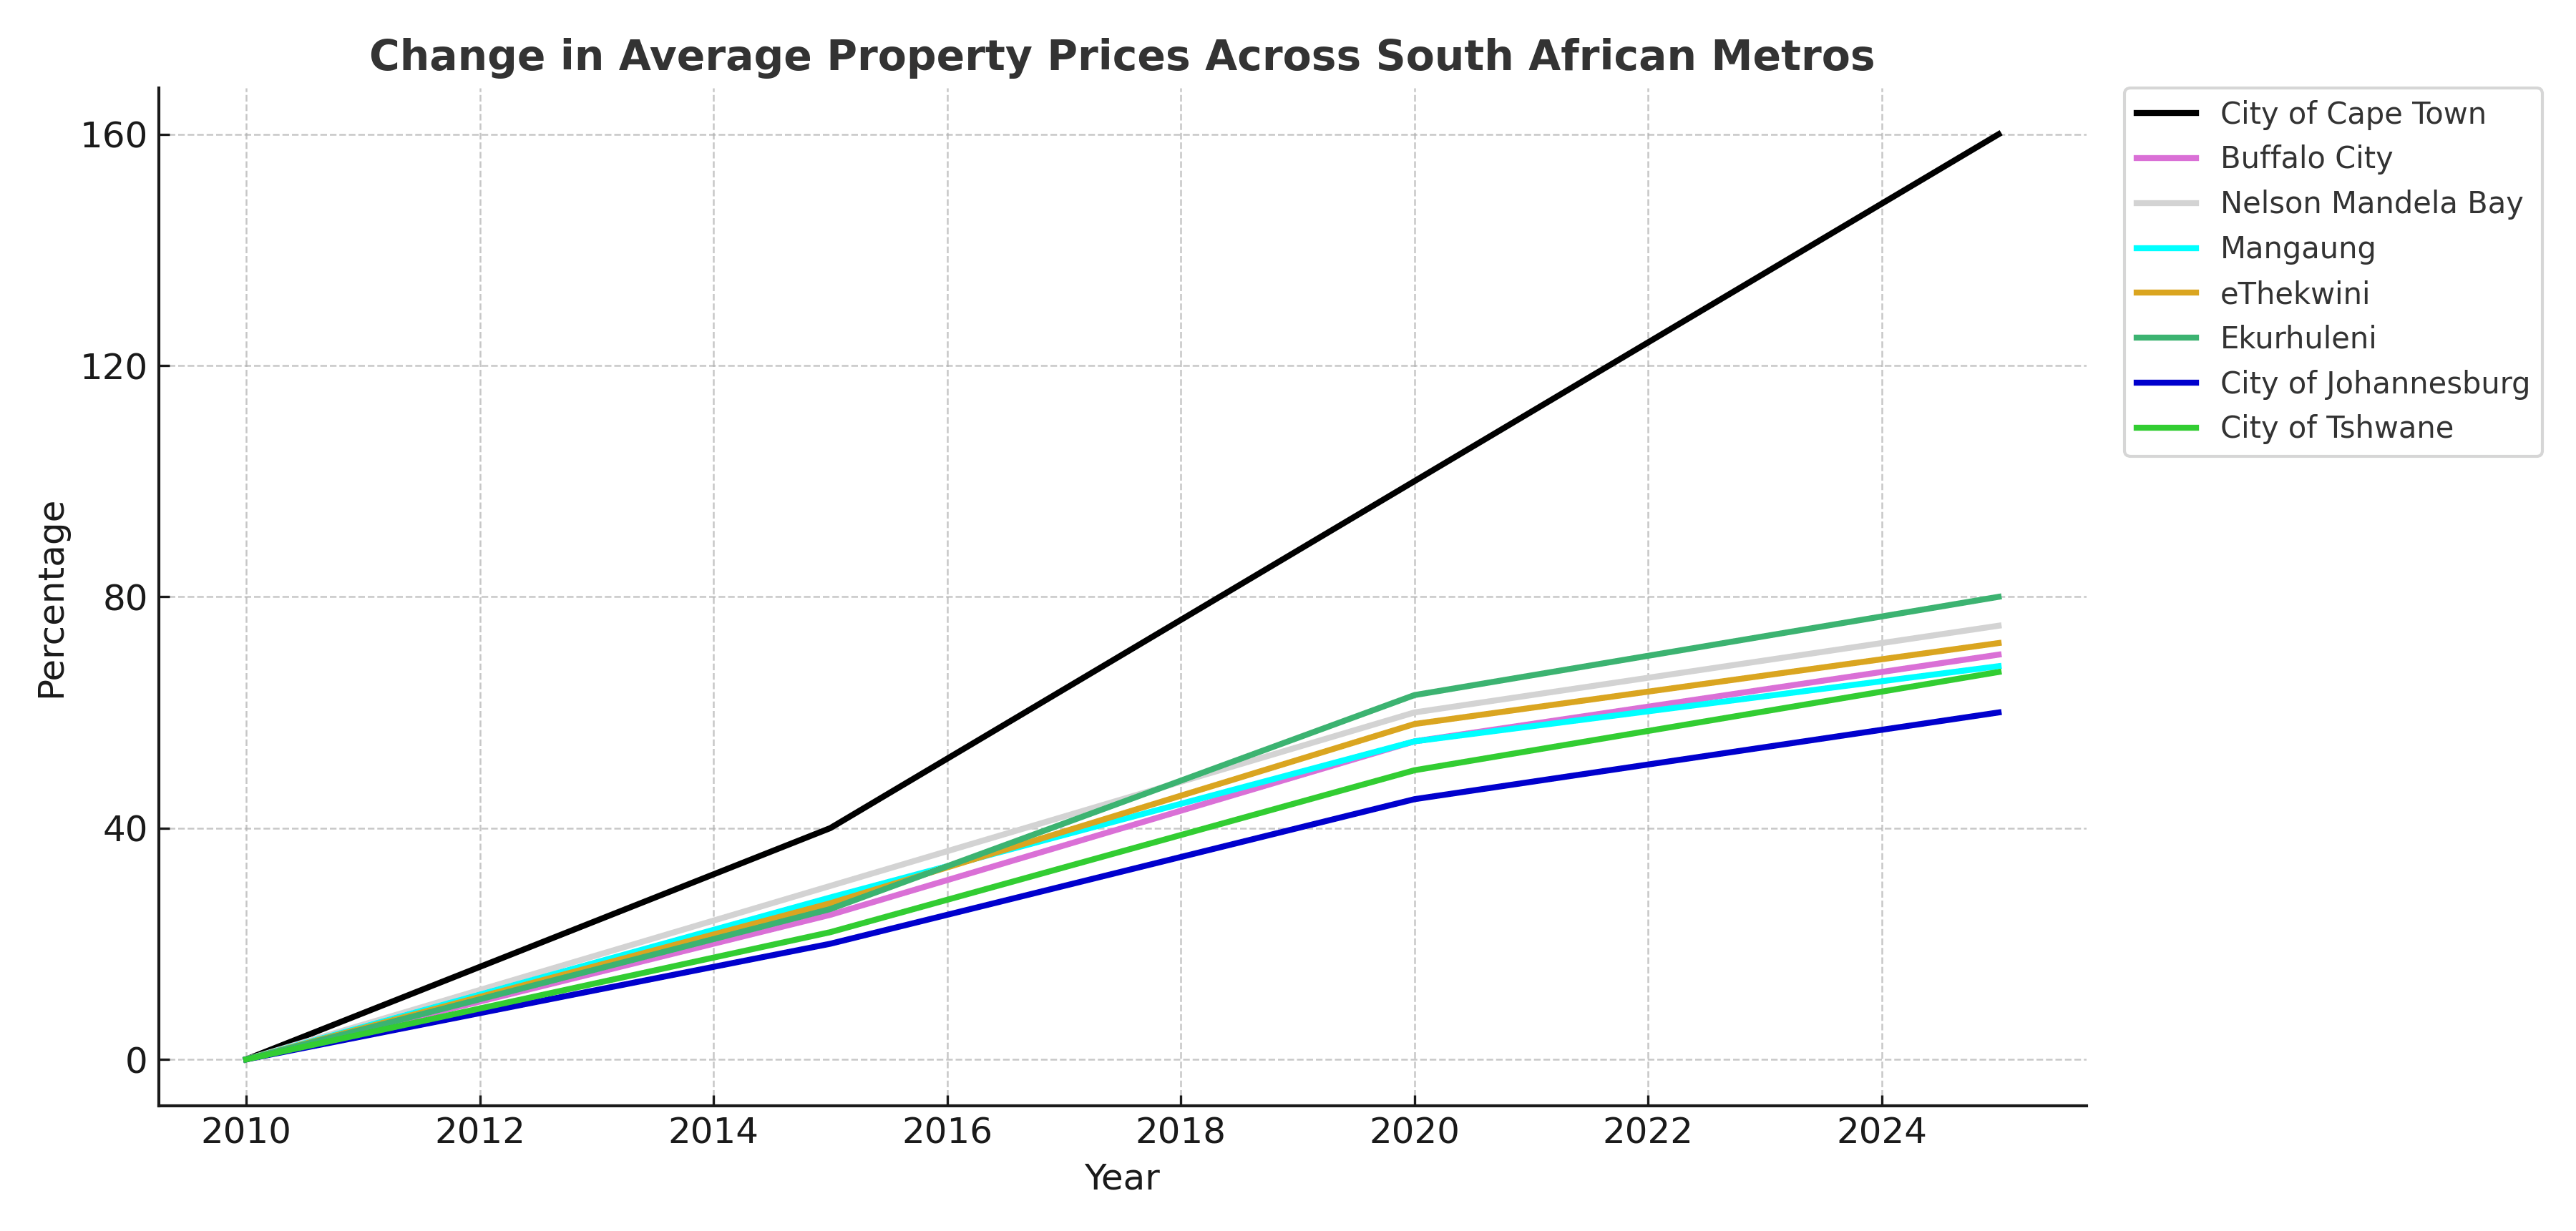
Description: Graph showing change in average property prices across all South African metros, for the years of 2010 through 2024
Title: Property Price Changes Across South African Metros, 2010 Through 2024
Credit: Own work
Author: ChatGPT
Usage Terms: Public domain
License: Public domain
Attribution Required?: No
Image usage
The following page links to this image:

All content from Kiddle encyclopedia articles (including the article images and facts) can be freely used under Attribution-ShareAlike license, unless stated otherwise.