
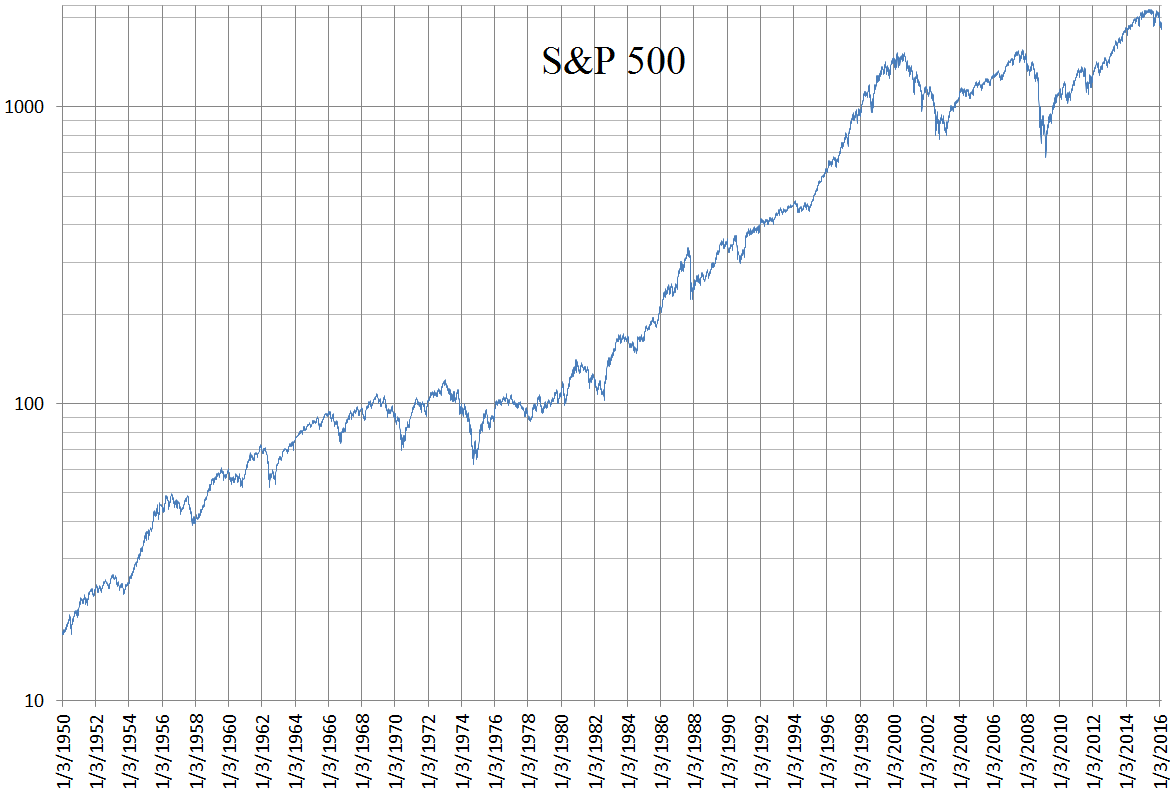
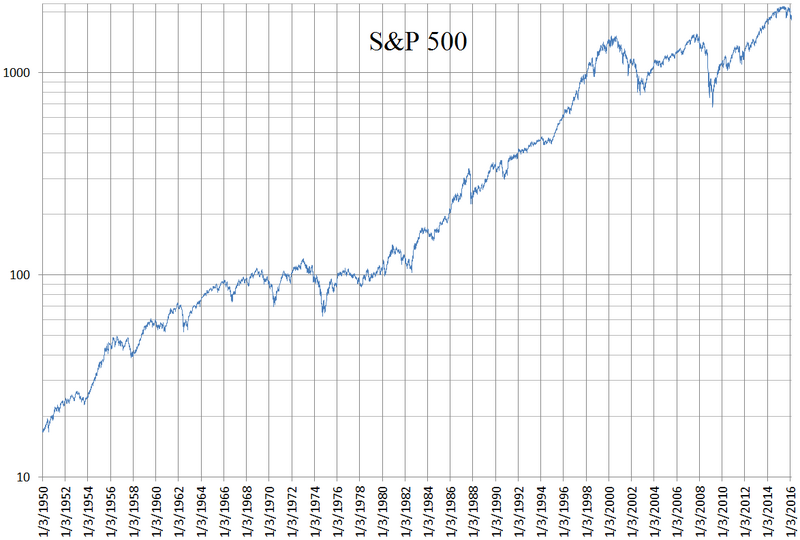
Image: S&P 500 daily logarithmic chart 1950 to 2016
Size of this preview: 800 × 540 pixels. Other resolutions: 320 × 216 pixels | 1,174 × 793 pixels.
Original image (1,174 × 793 pixels, file size: 44 KB, MIME type: image/png)
Description: A logarithmic chart of the S&P 500 using daily closing values from January 3rd, 1950 to February 19th, 2016.
Author: Overjive
Usage Terms: Creative Commons Attribution-Share Alike 3.0
License: CC-BY-SA-3.0
License Link: http://creativecommons.org/licenses/by-sa/3.0/
Attribution Required?: Yes
Image usage
The following page links to this image:

All content from Kiddle encyclopedia articles (including the article images and facts) can be freely used under Attribution-ShareAlike license, unless stated otherwise.