- This page was last modified on 17 October 2025, at 10:18. Suggest an edit.
S&P 500 facts for kids
The S&P 500 is a special list that tracks how well 500 of the biggest companies in the United States are doing in the stock market. Think of it like a report card for a large part of the U.S. economy. These 500 companies are so big that they make up about 80% of the total value of all public companies in the U.S. As of July 1, 2025, their total value was over $52.8 trillion!
The S&P 500 is a capitalization-weighted index. This means that bigger companies on the list have a greater impact on the index's overall value. For example, the ten largest companies make up about 38% of the index's total value. Some of these huge companies include Microsoft, Nvidia, Apple, and Amazon.com. The S&P 500 is managed by S&P Dow Jones Indices, and a special committee chooses which companies are included.

S&P 500 Index from 1970 to 2023
|
|
| Foundation | March 4, 1957 |
|---|---|
| Operator | S&P Dow Jones Indices |
| Exchanges | |
| Trading symbol |
|
| Constituents | 503 |
| Type | Large-cap |
| Market cap | US$52.831 trillion (as of July 1, 2025) |
| Weighting method | Free-float capitalization-weighted |
| Related indices |
|
Global Industry Classification Standard of components of the S&P 500 by market capitalization as of July 2, 2025 Energy (3.03%) Materials (1.94%) Industrials (8.57%) Consumer Discretionary (10.41%) Consumer Staples (5.51%) Healthcare (9.30%) Financials (14.01%) Information Technology (32.93%) Communication Services (9.63%) Utilities (2.37%) Real Estate (2.05%)
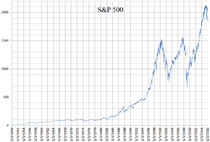
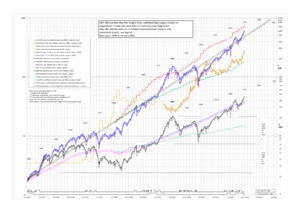
A linear chart of the S&P 500 daily closing values from January 3, 1950, to February 19, 2016
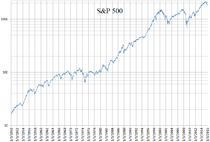
A logarithmic chart of the S&P 500 index daily closing values from January 3, 1950, to February 19, 2016
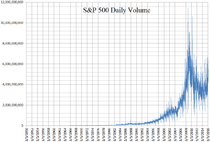
A daily volume chart of the S&P 500 index from January 3, 1950, to February 19, 2016
Contents
Investing in the S&P 500
You can't directly invest in the S&P 500 index itself, but you can invest in funds that try to copy its performance.
Index Funds and ETFs
Many people invest in the S&P 500 through special types of funds called index funds. These funds, like mutual funds and exchange-traded funds (ETFs), buy the same stocks as the S&P 500 in the same amounts. This way, their value goes up and down with the index.
Some popular ETFs that track the S&P 500 are:
- Vanguard (NYSE Arca: VOO)
- iShares (NYSE Arca: IVV)
- State Street (NYSE Arca: SPY and NYSE Arca: SPLG)
These funds let you own a small piece of all 500 companies without having to buy each stock separately.
Futures and Options
For more advanced investors, there are also financial tools called derivatives. These include futures and options that are based on the S&P 500's value. They are traded on exchanges like the Chicago Mercantile Exchange (CME) and the Chicago Board Options Exchange (CBOE). These are often used by professional traders.
History of the S&P 500
The story of the S&P 500 began a long time ago.
- In 1860, a man named Henry Varnum Poor started a company that published guides for investors.
- Later, in 1923, another company called Standard Statistics Company started rating bonds and created its first stock market index with 233 U.S. companies.
- In 1941, these two companies joined together to form Standard & Poor's.
The S&P 500 as we know it today was officially launched on March 4, 1957. That's when it expanded to include 500 companies and got its current name. Over the years, many important things happened:
- In 1976, The Vanguard Group created the first mutual fund that allowed everyday people to invest in the S&P 500.
- In the 1980s, new ways to trade based on the index, like futures and options, became available.
- Since 1986, the index's value has been updated very frequently, showing how quickly the market changes.
- In 1993, the first S&P 500 exchange-traded fund (ETF) started trading, making it even easier for people to invest.
How Companies are Chosen for the S&P 500
Unlike some other stock indexes that follow strict rules, the companies in the S&P 500 are chosen by a special committee. This committee looks at several important things when deciding if a company can join the index:
- Company Size: A company's total value (called market capitalization) must be at least US$22.7 billion as of July 1, 2025. Companies already in the index don't get removed just for falling below this number, unless there are other reasons.
- How Easily Shares are Traded: The company's shares need to be actively traded. This means a lot of shares are bought and sold regularly.
- Trading Activity: The company must have traded at least 250,000 shares each month for the six months before the review.
- Where They are Listed: The company's main stock listing must be on a U.S. exchange, like the New York Stock Exchange (NYSE) or Nasdaq.
- What Kind of Company: Certain types of companies or investments are not allowed in the index.
When a company is added to the S&P 500, its stock value might go up. This is because index funds that track the S&P 500 will need to buy shares of that company to keep their investments matching the index.
S&P 500 Performance
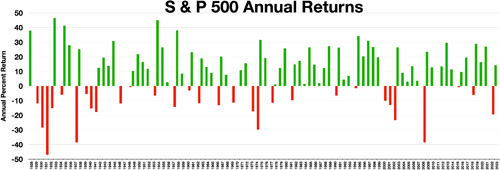
Since it started in 1926, the S&P 500 has grown quite a bit over time. On average, it has increased by about 9.8% each year, including money paid out to shareholders (called dividends). Even after considering inflation (when money buys less), it has grown about 6% per year.
While the index has had some tough years where it dropped a lot (sometimes over 30%), it has also gone up in value about 70% of the time. This means that more often than not, the S&P 500 has seen positive growth.
The S&P 500 reached its highest point ever, 6,280.46, on July 10, 2025. Earlier in the year, it had a "correction," which means it dropped between 10% and 20%. It fell to 4,982.77 on April 8 before starting to recover.
See also
 In Spanish: S&P 500 para niños
- List of S&P 500 companies
- SPDR S&P 500 ETF Trust
- S&P Dow Jones Indices

