
Image: ST diagram of N2 01

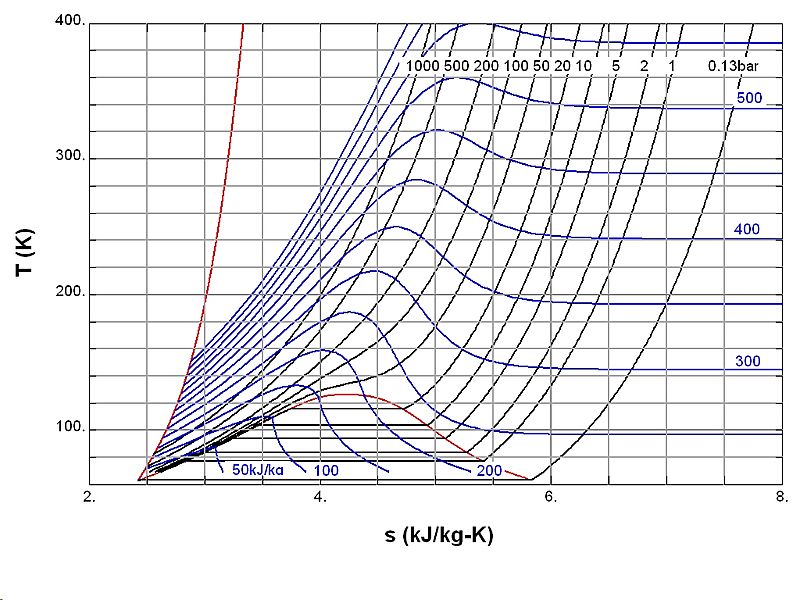
Description: s-T diagram of nitrogen, generated from NIST RefProp data. Temperature–entropy diagram of nitrogen. The red curve at the left is the melting curve. The red dome represents the two-phase region with the low-entropy side the saturated liquid and the high-entropy side the saturated gas. The black curves give the s-T relation along isobars (pressures are indicated in bar). The blue curves are isenthalps (values given in kJ/kg).
Title: ST diagram of N2 01
Credit: data from RefProp, file generated using SlideWrite
Author: Adwaele
Usage Terms: Creative Commons Attribution-ShareAlike 3.0
License: CC-BY-SA-3.0
License Link: https://creativecommons.org/licenses/by-sa/3.0/
Attribution Required?: Yes
Image usage
The following page links to this image:
