
Image: SimpleGenotypePhenotypeMap

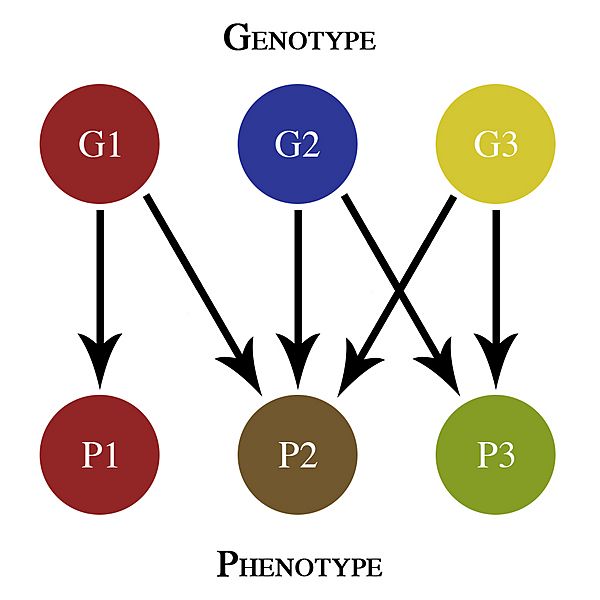
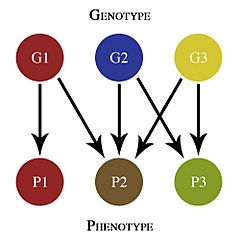
Description: A very simple genotype-phenotype map that only shows additive pleiotropy effects. G1, G2, and G3 are different genes that contribute to phenotypes P1, P2, and P3. For all intents and purposes, G1 contributes a red color to the phenotype of an organism, G2 contributes a blue color to the phenotype of an organism, and G3 contributes a yellow color to the phenotype of an organism. Please note that these are not real genes, and any similarity to existing genes is purely coincidental. Interpretation of this simple map shows that G1 is the only gene that contributes to the P1 phenotype; thus, this phenotype is red. G1, G2, and G3 contribute to P2; thus, this phenotype is brown. G2 and G3 contribute to P3; thus, this phenotype is green.
Title: SimpleGenotypePhenotypeMap
Credit: Own work
Author: Alphillips6
Usage Terms: Creative Commons Attribution-Share Alike 4.0
License: CC BY-SA 4.0
License Link: http://creativecommons.org/licenses/by-sa/4.0
Attribution Required?: Yes
Image usage
The following page links to this image:
