
Image: Sirsys-p9
No higher resolution available.
Sirsys-p9.png (560 × 420 pixels, file size: 7 KB, MIME type: image/png)
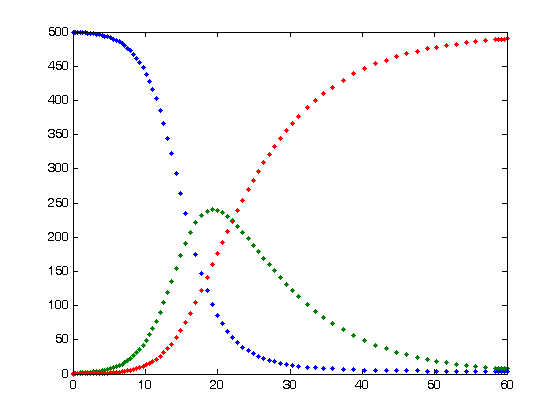
Description: (Colors are believed to be: Blue=Susceptible, Green=Infected, and Red=Recovered) An epidemiological graph for the SIR model. S represents the number of susceptibles, I the number of infectious people and R the number of recovered. Graph generated using MATLAB code:
Title: Sirsys-p9
Credit: No machine-readable source provided. Own work assumed (based on copyright claims).
Author: No machine-readable author provided. Bye~commonswiki assumed (based on copyright claims).
Usage Terms: Public domain
License: Public domain
Attribution Required?: No
Image usage
The following page links to this image:

All content from Kiddle encyclopedia articles (including the article images and facts) can be freely used under Attribution-ShareAlike license, unless stated otherwise.