
SIR model facts for kids
The SIR model is a simple mathematical way to understand how epidemics spread. An epidemic happens when a disease quickly infects more and more people in a population. The letters S, I, and R stand for different groups of people during an epidemic:
- S - Susceptible: These are people who have not yet caught the disease. They are not immune, so they can get sick in the future.
- I - Infected or Infectious: These are people who currently have the disease. They can spread it to others who are susceptible.
- R - Recovered: These are people who have had the disease and are now better. They are immune to it, meaning they usually cannot get it again.
This model helps scientists predict how a disease might spread and how many people might get sick.
Contents
How the SIR Model Works
Imagine a group of people. Some are healthy and can get sick (Susceptible). A few are already sick (Infected). And some have gotten better and can't get sick again (Recovered). The SIR model tracks how the number of people in each group changes over time.
Tracking the Disease Spread

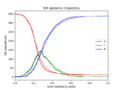
The graph above shows a typical SIR model in action. The bottom line (x-axis) is time, and the side line (y-axis) is the number of people.
- Blue line (Susceptible): At the start, most people are susceptible (blue line is high). As the disease spreads, the number of susceptible people goes down because they are getting infected.
- Green line (Infected): The number of infected people (green line) goes up quickly as the disease spreads. This is the peak of the epidemic. Then, as people recover or there are fewer susceptible people to infect, the number of infected people goes down.
- Red line (Recovered): The number of recovered people (red line) slowly increases as infected people get better. In this example, nearly everyone eventually recovers.
Sometimes, not everyone gets infected. Some susceptible people might remain healthy even after the epidemic is over.
What the SIR Model Doesn't Show
The basic SIR model is a good starting point, but it's very simple. It doesn't include everything that happens in real life.
Missing Parts of the Model
For example, this model doesn't include:
- Births: New babies are born, adding more susceptible people to the population.
- Deaths: People can die from the disease, or from other causes, which removes them from any of the S, I, or R groups.
More complex models can add these details to make them more realistic.
When the SIR Model Works Best
The SIR model works well for diseases where people get sick, recover, and then become immune for a long time. Measles is a good example of such a disease.
However, it doesn't work for every disease:
- No Recovery or Immunity: For diseases like HIV, people who are infected usually do not recover and become immune. So, there isn't a "recovered" group in the same way.
- Temporary Immunity: With diseases like the flu, people might recover, but their immunity only lasts for a short time. They can become susceptible again later.
Also, this model doesn't cover diseases spread in other ways, like through water (like cholera) or by insects (like malaria spread by a mosquito). Scientists use different models for those types of diseases.
Images for kids
-
Spatial SIR model simulation. Each cell can infect its eight immediate neighbors.
-
A single example of the SIR epidemic.
-
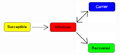
A simple modification to show the word "Carrier".
-

A different type of model called SEIR.


