
Image: Sydney statistical areas
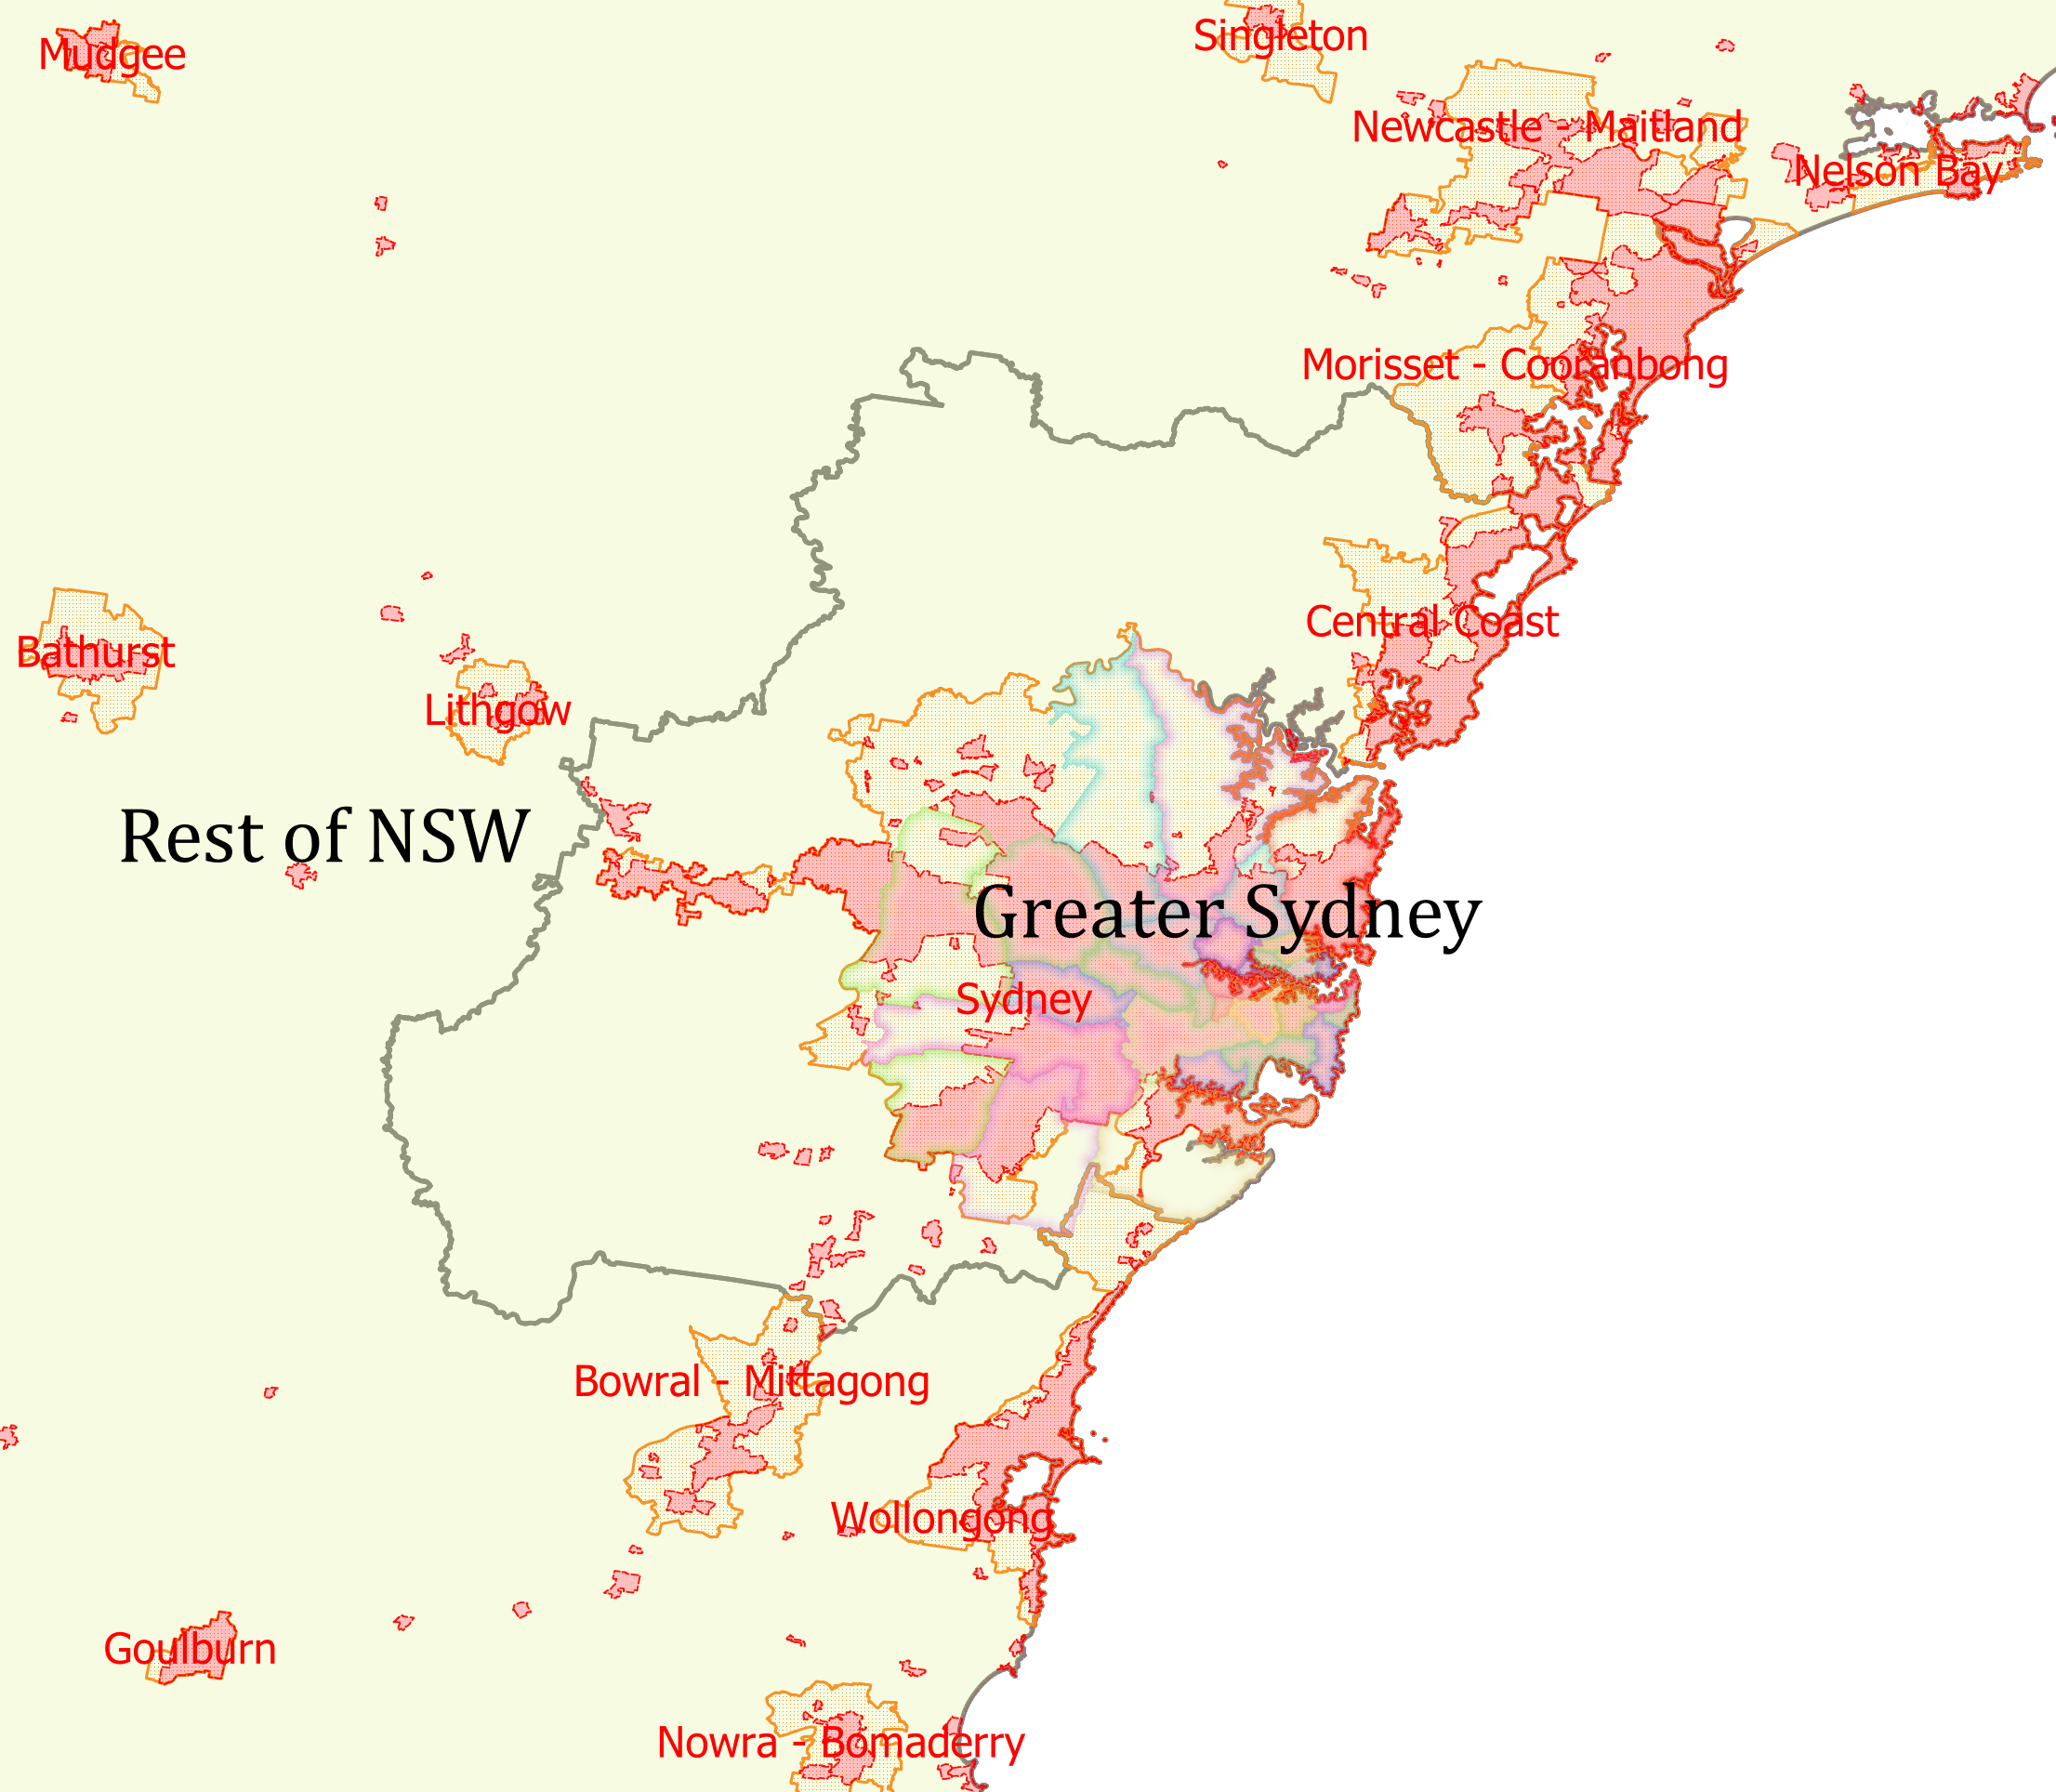
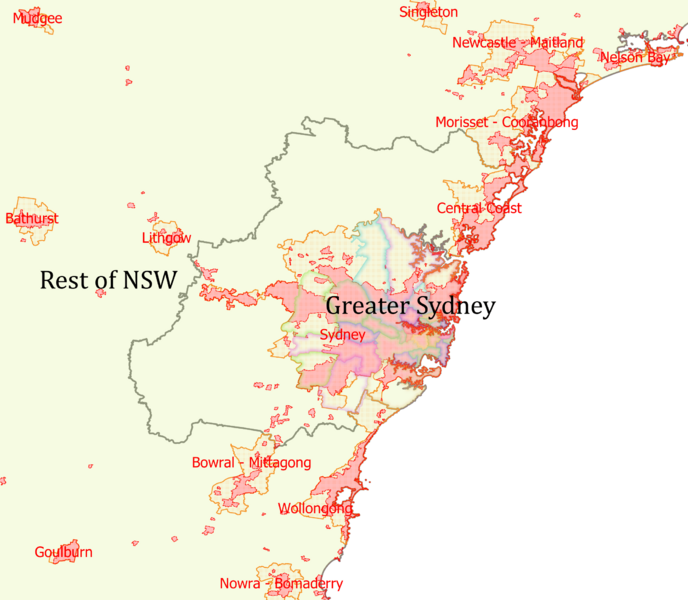
Description: Shown are the various statistical areas defined by the Australian Bureau of Statistics for Sydney and its surrounding area. Thick grey line/black text: the extent of the Greater Sydney *Greater Capital City Statistical Area* (One of eight unique statistical divisions delineating the broadest possible concept of each state/territory capital city, made up of one or more whole labour market area (SA4)), as well as the Rest of NSW area Solid orange lines with stippled fill/red text: *Significant Urban Areas* (statistical divisions representing significant towns and cities of 10,000 people or more, consisting of single or clusters (agglomerations) of urban centres and localities, made up of one or more SA2 units, which are collations of suburbs and localities designed for consistent statistical output) Dashed red lines with pink fill: *Urban Centres/Localities* (statistical divisions delineating the contiguous built up, or urban areas of cities, towns and small settlements, made up of the smallest statistical output areas (SA1)) Outlined coloured areas: the 31 Local Government Areas commonly understood as comprising Sydney, albeit unofficially (e.g. per Wikipedia) Made in QGIS 3.12, using shapefile data from the ABS, licensed under Creative Commons 4.0, see https://www.abs.gov.au/websitedbs/D3310114.nsf/Home/Creative%20Commons%20licensing
Title: Sydney statistical areas
Credit: Own work
Author: Randwicked
Usage Terms: Creative Commons Attribution-Share Alike 4.0
License: CC BY-SA 4.0
License Link: https://creativecommons.org/licenses/by-sa/4.0
Attribution Required?: Yes
Image usage
The following page links to this image:
