List of cities in Australia by population facts for kids
Australia has many cities and towns, and we can rank them by how many people live in them! This article shows different ways to count people in Australian cities, using information from the Australian Bureau of Statistics (ABS).
We'll look at a few types of areas:
- Greater Capital City Statistical Areas (GCCSAs): These are the big areas around Australia's main capital cities.
- Significant Urban Areas (SUAs): These are important towns and cities with at least 10,000 people.
- Urban Centres: These are the actual built-up areas of cities and towns.
- Local Government Areas (LGAs): These are the local councils that manage different parts of Australia.
Contents
Australia's Biggest Capital City Areas
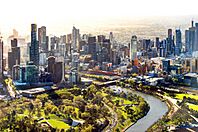
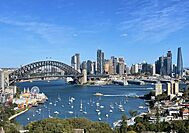
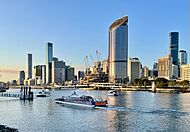
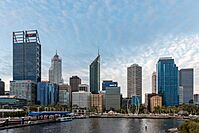
Each capital city in Australia has its own Greater Capital City Statistical Area (GCCSA). The Australian Bureau of Statistics uses these areas to show the full size of each capital city, including the city itself and its surrounding areas where people live and work. When you hear about the population of a capital city in Australia, it's usually this number! These areas are a bit like what other countries call "metropolitan areas."
| Rank | Greater Capital City Statistical Area | State/territory | Estimated resident population | Growth from 2011 to 2022 |
Included SUAs | |
|---|---|---|---|---|---|---|
| June 2023 | June 2011 | |||||
| 1 | Greater Sydney | 5,450,496 | 4,608,949 | +18.26% | Sydney Central Coast |
|
| 2 | Greater Melbourne | 5,207,145 | 4,169,366 | +24.89% | Melbourne Bacchus Marsh Gisborne |
|
| 3 | Greater Brisbane | 2,706,966 | 2,147,436 | +26.06% | Brisbane | |
| 4 | Greater Perth | 2,309,338 | 1,833,567 | +25.95% | Perth | |
| 5 | Greater Adelaide | 1,446,380 | 1,264,091 | +14.42% | Adelaide | |
| 6 | Australian Capital Territory | 466,566 | 367,985 | +26.79% | Canberra–Queanbeyan (ACT part only) |
|
| 7 | Greater Hobart | 253,654 | 216,273 | +17.28% | Hobart | |
| 8 | Greater Darwin | 150,736 | 129,106 | +16.75% | Darwin | |
Significant Urban Areas by Population
Significant Urban Areas (SUAs) are places that are important towns or cities, or groups of smaller towns, that have at least 10,000 people living in them. These areas might even include more than one "Urban Centre" (which we'll explain next).
Did you know that 70% of all Australians live in the top eight most populated cities? That's a lot of people in just a few places!
The table below ranks the SUAs. You'll see that the capital cities are listed here too, but their SUA populations are usually smaller than their GCCSA populations. The only exception is Canberra, whose SUA includes nearby Queanbeyan in New South Wales.
| Rank | Significant Urban Area |
State/territory | Estimated resident population | Growth from 2011 to 2023 |
|
|---|---|---|---|---|---|
| June 2023 | June 2011 | ||||
| 1 | Melbourne | 5,103,528 | 4,087,822 | +24.85% | |
| 2 | Sydney | 5,041,275 | 4,240,340 | +18.89% | |
| 3 | Brisbane | 2,622,585 | 2,076,608 | +26.29% | |
| 4 | Perth | 2,289,366 | 1,817,023 | +26.00% | |
| 5 | Adelaide | 1,426,803 | 1,245,896 | +14.52% | |
| 6 | Gold Coast–Tweed Heads | 735,213 | 581,036 | +26.53% | |
| 7 | Newcastle–Maitland | 526,515 | 453,265 | +16.16% | |
| 8 | Canberra–Queanbeyan | 503,402 | 405,032 | +24.29% | |
| 9 | Sunshine Coast | 407,859 | 303,824 | +34.24% | |
| 10 | Central Coast | 348,435 | 314,941 | +10.64% | |
| 11 | Wollongong | 313,745 | 281,700 | +11.38% | |
| 12 | Geelong | 302,046 | 227,957 | +32.50% | |
| 13 | Hobart | 232,450 | 198,534 | +17.08% | |
| 14 | Townsville | 186,734 | 167,561 | +11.44% | |
| 15 | Cairns | 160,933 | 139,212 | +15.60% | |
| 16 | Toowoomba | 149,817 | 126,426 | +18.50% | |
| 17 | Darwin | 137,002 | 116,995 | +17.10% | |
| 18 | Ballarat | 116,390 | 93,459 | +24.54% | |
| 19 | Bendigo | 104,883 | 87,340 | +20.09% | |
| 20 | Albury-Wodonga | 100,095 | 84,195 | +18.88% | |
| 21 | Launceston | 93,364 | 86,051 | +8.50% | |
| 22 | Mackay | 88,162 | 79,683 | +10.64% | |
| 23 | Rockhampton | 81,937 | 78,598 | +4.25% | |
| 24 | Bunbury | 81,367 | 67,860 | +19.90% | |
| 25 | Bundaberg | 77,261 | 69,095 | +11.82% | |
| 26 | Coffs Harbour | 75,838 | 66,689 | +13.72% | |
| 27 | Hervey Bay | 60,838 | 49,835 | +22.08% | |
| 28 | Wagga Wagga | 57,807 | 54,137 | +6.78% | |
| 29 | Shepparton-Mooroopna | 54,494 | 47,571 | +14.55% | |
| 30 | Mildura-Buronga | 54,427 | 48,505 | +12.21% | |
| 31 | Port Macquarie | 51,965 | 43,275 | +20.08% | |
| 32 | Gladstone | 47,294 | 43,166 | +9.56% | |
| 33 | Ballina | 47,188 | 40,674 | +16.02% | |
| 34 | Warragul–Drouin | 45,597 | 30,287 | +50.55% | |
| 35 | Tamworth | 45,496 | 40,085 | +13.50% | |
| 36 | Busselton | 43,853 | 31,475 | +39.33% | |
| 37 | Traralgon–Morwell | 43,739 | 40,609 | +7.71% | |
| 38 | Orange | 42,642 | 37,785 | +12.85% | |
| 39 | Bowral–Mittagong | 41,982 | 36,266 | +15.76% | |
| 40 | Dubbo | 41,801 | 35,281 | +18.48% | |
| 41 | Geraldton | 41,086 | 36,884 | +11.39% | |
| 42 | Nowra–Bomaderry | 39,702 | 34,604 | +14.73% | |
| 43 | Bathurst | 38,339 | 33,754 | +13.58% | |
| 44 | Albany | 37,037 | 31,791 | +16.50% | |
| 45 | Warrnambool | 36,238 | 33,020 | +9.75% | |
| 46 | Devonport | 32,848 | 30,425 | +7.96% | |
| 47 | Mount Gambier | 30,583 | 28,279 | +8.15% | |
| 48 | Kalgoorlie–Boulder | 30,504 | 31,933 | −4.47% | |
| 49 | Victor Harbor–Goolwa | 29,798 | 24,422 | +22.01% | |
| 50 | Morisset–Cooranbong | 29,421 | 22,644 | +29.93% | |
| 51 | Alice Springs | 29,213 | 28,489 | +2.54% | |
| 52 | Nelson Bay | 28,674 | 26,116 | +9.79% | |
| 53 | Burnie–Somerset | 28,663 | 28,019 | +2.30% | |
| 54 | Maryborough | 28,346 | 26,893 | +5.40% | |
| 55 | Lismore | 28,199 | 29,294 | −3.74% | |
| 56 | Taree | 26,740 | 26,307 | +1.65% | |
| 57 | Bacchus Marsh | 26,055 | 17,488 | +48.99% | |
| 58 | Goulburn | 25,017 | 22,202 | +12.68% | |
| 59 | Armidale | 24,373 | 23,471 | +3.84% | |
| 60 | Gympie | 23,497 | 19,971 | +17.66% | |
| 61 | Gisborne | 23,056 | 18,570 | +24.16% | |
| 62 | Echuca–Moama | 22,979 | 19,659 | +16.89% | |
| 63 | Moe–Newborough | 22,170 | 21,432 | +3.44% | |
| 64 | Whyalla | 21,807 | 22,471 | −2.95% | |
| 65 | Yeppoon | 21,688 | 16,815 | +28.98% | |
| 66 | Forster–Tuncurry | 21,074 | 20,273 | +3.95% | |
| 67 | Griffith | 20,538 | 18,683 | +9.93% | |
| 68 | St Georges Basin–Sanctuary Point | 20,200 | 16,967 | +19.05% | |
| 69 | Wangaratta | 19,969 | 17,980 | +11.06% | |
| 70 | Grafton | 19,607 | 19,051 | +2.92% | |
| 71 | Murray Bridge | 19,371 | 17,071 | +13.47% | |
| 72 | Camden Haven | 19,000 | 16,267 | +16.80% | |
| 73 | Karratha | 18,631 | 17,007 | +9.55% | |
| 74 | Mount Isa | 18,518 | 21,417 | −13.54% | |
| 75 | Batemans Bay | 17,692 | 16,352 | +8.19% | |
| 76 | Broken Hill | 17,624 | 19,151 | −7.97% | |
| 77 | Singleton | 17,503 | 16,730 | +4.62% | |
| 78 | Ulladulla | 17,330 | 14,758 | +17.43% | |
| 79 | Port Lincoln | 16,991 | 15,621 | +8.77% | |
| 80 | Horsham | 16,876 | 16,099 | +4.83% | |
| 81 | Port Hedland | 16,834 | 14,372 | +17.13% | |
| 82 | Kempsey | 16,143 | 14,796 | +9.10% | |
| 83 | Warwick | 16,064 | 14,950 | +7.45% | |
| 84 | Medowie | 16,058 | 12,686 | +26.58% | |
| 85 | Broome | 16,008 | 13,314 | +20.23% | |
| 86 | Bairnsdale | 15,819 | 13,458 | +17.54% | |
| 87 | Airlie Beach-Cannonvale | 15,723 | 10,982 | +43.17% | |
| 88 | Ulverstone | 15,408 | 14,739 | +4.54% | |
| 89 | Sale | 15,363 | 14,441 | +6.38% | |
| 90 | Emerald | 14,914 | 13,632 | +9.40% | |
| 91 | Port Pirie | 14,169 | 14,281 | −0.78% | |
| 92 | Port Augusta | 14,082 | 14,084 | −0.01% | |
| 93 | Colac | 12,640 | 11,981 | +5.50% | |
| 94 | Muswellbrook | 12,590 | 12,222 | +3.01% | |
| 95 | Esperance | 12,565 | 11,777 | +6.69% | |
| 96 | Mudgee | 12,563 | 10,832 | +15.98% | |
| 97 | Lithgow | 12,253 | 12,686 | −3.41% | |
| 98 | Castlemaine | 11,495 | 9,920 | +15.88% | |
| 99 | Portland | 11,181 | 10,894 | +2.63% | |
| 100 | Byron Bay | 11,053 | 9,237 | +19.66% | |
| 101 | Swan Hill | 10,948 | 10,610 | +3.19% | |
| 102 | Kingaroy | 10,898 | 10,074 | +8.18% | |
Understanding Urban Centres
The Australian Bureau of Statistics defines an "Urban Centre" as a group of 1,000 or more people living close together. When we talk about people living in urban centres, it means they live in a city or town. These numbers show the population of the actual built-up areas of each city. The populations for Urban Centres are only updated after each census, so they might not be as current as the other population figures.
| Rank (2016) |
Urban Centre | Estimated resident population | SUA (if part of a larger SUA) |
Ranking in state or territory, 2016 | |||||||||||
|---|---|---|---|---|---|---|---|---|---|---|---|---|---|---|---|
| 2016 census | 2011 census | 2006 census | ACT | NSW | NT | Qld | SA | Tas | WA | Vic | |||||
| 1 | Sydney | 4,321,535 | 3,908,642 | 3,641,422 | 1 | ||||||||||
| 2 | Melbourne | 4,196,198 | 3,707,530 | 3,371,888 | 1 | ||||||||||
| 3 | Brisbane | 2,054,614 | 1,874,427 | 1,676,389 | 1 | ||||||||||
| 4 | Perth | 1,874,578 | 1,627,576 | 1,256,035 | 1 | ||||||||||
| 5 | Adelaide | 1,165,632 | 1,103,979 | 1,040,719 | 1 | ||||||||||
| 6 | Gold Coast–Tweed Heads (Gold Coast part) | 540,559 | 478,107 | Gold Coast–Tweed Heads | 2 | ||||||||||
| 7 | Canberra–Queanbeyan (Canberra part) | 395,790 | 355,596 | Canberra–Queanbeyan | 1 | ||||||||||
| 8 | Newcastle | 322,278 | 308,308 | 288,732 | Newcastle–Maitland | 2 | |||||||||
| 9 | Central Coast | 307,742 | 297,713 | 282,726 | 3 | ||||||||||
| 10 | Wollongong | 261,896 | 245,942 | 234,482 | 4 | ||||||||||
| 11 | Sunshine Coast | 243,377 | 209,263 | 184,662 | 3 | ||||||||||
| 12 | Hobart | 178,009 | 170,975 | 128,557 | 1 | ||||||||||
| 13 | Townsville | 168,729 | 157,748 | 128,808 | 4 | ||||||||||
| 14 | Geelong | 157,104 | 143,291 | 137,220 | 2 | ||||||||||
| 15 | Cairns | 144,730 | 133,893 | 98,349 | 5 | ||||||||||
| 16 | Darwin | 118,456 | 103,016 | 89,905 | 1 | ||||||||||
| 17 | Toowoomba | 100,032 | 96,597 | 95,265 | 6 | ||||||||||
| 18 | Ballarat | 93,759 | 85,935 | 78,221 | 3 | ||||||||||
| 19 | Bendigo | 92,379 | 82,794 | 76,051 | 4 | ||||||||||
| 20 | Maitland | 78,015 | 67,132 | 61,431 | Newcastle–Maitland | 5 | |||||||||
| 21 | Mackay | 75,710 | 74,219 | 66,874 | 7 | ||||||||||
| 22 | Launceston | 75,329 | 74,085 | 71,395 | 2 | ||||||||||
| 23 | Bunbury | 71,090 | 64,385 | 54,482 | 2 | ||||||||||
| 24 | Rockhampton | 61,214 | 61,724 | 60,827 | 8 | ||||||||||
| 25 | Gold Coast–Tweed Heads (Tweed Heads part) | 59,776 | 55,553 | Gold Coast–Tweed Heads | 6 | ||||||||||
| 26 | Melton | 54,456 | 45,624 | 35,490 | Melbourne | 5 | |||||||||
| 27 | Hervey Bay | 52,073 | 48,680 | 41,225 | 9 | ||||||||||
| 28 | Bundaberg | 50,148 | 49,750 | 46,961 | 10 | ||||||||||
| 29 | Wagga Wagga | 48,263 | 46,913 | 46,735 | 7 | ||||||||||
| 30 | Coffs Harbour | 48,225 | 45,580 | 26,353 | 8 | ||||||||||
| 31 | Albury–Wodonga (Albury part) | 47,974 | 45,627 | Albury–Wodonga | 9 | ||||||||||
| 32 | Shepparton–Mooroopna | 46,199 | 42,741 | 38,773 | 6 | ||||||||||
| 33 | Port Macquarie | 44,814 | 41,491 | 39,219 | 10 | ||||||||||
| 34 | Orange | 37,182 | 34,992 | 31,544 | 11 | ||||||||||
| 35 | Canberra–Queanbeyan (Queanbeyan part) | 36,248 | 35,878 | Canberra–Queanbeyan | 12 | ||||||||||
| 36 | Albury–Wodonga (Wodonga part) | 35,130 | 31,605 | Albury–Wodonga | 7 | ||||||||||
| 37 | Sunbury | 34,425 | 33,062 | 29,566 | Melbourne | 8 | |||||||||
| 38 | Dubbo | 34,339 | 32,327 | 30,574 | 13 | ||||||||||
| 39 | Tamworth | 33,885 | 36,131 | 33,475 | 14 | ||||||||||
| 40 | Bathurst | 33,587 | 31,294 | 28,992 | 15 | ||||||||||
| 41 | Mildura–Buronga (Mildura part) | 33,444 | 31,361 | Mildura–Wentworth | 9 | ||||||||||
| 42 | Gladstone | 33,418 | 32,073 | 28,808 | Gladstone–Tannum Sands | 11 | |||||||||
| 43 | Geraldton | 31,982 | 31,349 | 27,420 | 3 | ||||||||||
| 44 | Nowra–Bomaderry | 30,853 | 27,988 | 27,478 | 16 | ||||||||||
| 45 | Warrnambool | 30,709 | 29,284 | 10 | |||||||||||
| 46 | Kalgoorlie–Boulder | 29,875 | 30,840 | 28,242 | 4 | ||||||||||
| 47 | Albany | 29,373 | 26,643 | 25,196 | 5 | ||||||||||
| 48 | Blue Mountains | 29,319 | 28,769 | Sydney | 17 | ||||||||||
| 49 | Lismore | 27,569 | 27,474 | 27,069 | 18 | ||||||||||
| 50 | Gawler | 26,472 | 23,957 | 20,006 | Adelaide | 2 | |||||||||
Local Government Areas by Population
In Australia, Local Government Areas (LGAs) are the groups that manage local services. They can be called cities, councils, regions, shires, or towns. About 90% of Australia is covered by these local governments. Some parts of South Australia and New South Wales don't have a local government, and neither does the Australian Capital Territory.
The City of Brisbane is special because its local government area covers a large part of the actual city. For other capital cities, the main local government area is much smaller than the whole city. For example, in June 2020, the City of Darwin had about 82,030 people, City of Hobart had 55,250, City of Perth had 30,971, and City of Adelaide had 26,177. Many suburban local government areas in capital cities actually have more people than the central city's LGA!
| Rank (2021) |
Local government area | Estimated resident population | Ranking in state, 2021 | ||||||
|---|---|---|---|---|---|---|---|---|---|
| 2021 | 2019 | Qld | NSW | WA | Vic | SA | |||
| 1 | City of Brisbane | 1,272,461 | 1,253,647 | 1 | |||||
| 2 | City of Gold Coast | 643,461 | 620,437 | 2 | |||||
| 3 | City of Moreton Bay | 486,645 | 469,442 | 3 | |||||
| 4 | City of Blacktown | 387,104 | 374,372 | 1 | |||||
| 5 | City of Canterbury-Bankstown | 378,425 | 377,836 | 2 | |||||
| 6 | City of Casey | 368,861 | 353,962 | 1 | |||||
| 7 | City of Logan | 348,020 | 334,353 | 4 | |||||
| 8 | Central Coast Council | 347,158 | 343,922 | 3 | |||||
| 9 | Sunshine Coast Region | 343,590 | 328,390 | 5 | |||||
| 10 | City of Wyndham | 289,571 | 270,607 | 2 | |||||
| 11 | Northern Beaches Council | 272,184 | 273,409 | 4 | |||||
| 12 | City of Greater Geelong | 269,508 | 258,938 | 3 | |||||
| 13 | City of Parramatta | 258,799 | 257,094 | 5 | |||||
| 14 | City of Hume | 243,738 | 233,545 | 4 | |||||
| 15 | City of Sydney | 242,237 | 245,942 | 6 | |||||
| 16 | Cumberland Council | 239,834 | 241,453 | 7 | |||||
| 17 | City of Whittlesea | 237,932 | 220,297 | 5 | |||||
| 18 | City of Ipswich | 236,708 | 222,311 | 6 | |||||
| 19 | City of Liverpool | 234,917 | 227,545 | 8 | |||||
| 20 | Sutherland Shire | 234,275 | 230,579 | 9 | |||||
| 21 | City of Stirling | 223,260 | 221,238 | 1 | |||||
| 22 | City of Wollongong | 220,659 | 218,076 | 10 | |||||
| 23 | City of Penrith | 219,173 | 212,944 | 11 | |||||
| 24 | City of Wanneroo | 215,878 | 208,360 | 2 | |||||
| 25 | City of Lake Macquarie | 210,031 | 205,875 | 12 | |||||
| 26 | City of Fairfield | 207,922 | 211,654 | 13 | |||||
| 27 | City of Brimbank | 201,680 | 209,568 | 6 | |||||
| 28 | Inner West Council | 199,759 | 200,720 | 14 | |||||
| 29 | City of Townsville | 197,992 | 195,022 | 7 | |||||
| 30 | City of Monash | 197,980 | 202,896 | 7 | |||||
| 31 | The Hills Shire | 188,557 | 177,927 | 15 | |||||
| 32 | City of Merri-bek | 184,707 | 185,811 | 8 | |||||
| 33 | Bayside Council | 182,369 | 178,351 | 16 | |||||
| 34 | City of Melton | 179,107 | 164,936 | 9 | |||||
| 35 | City of Boroondara | 176,632 | 183,197 | 10 | |||||
| 36 | City of Whitehorse | 175,970 | 178,779 | 11 | |||||
| 37 | City of Onkaparinga | 175,711 | 172,945 | 1 | |||||
| 38 | City of Campbelltown | 175,687 | 170,912 | 17 | |||||
| 39 | Toowoomba Region | 171,135 | 168,992 | 8 | |||||
| 40 | City of Melbourne | 169,860 | 178,994 | 12 | |||||
| 41 | City of Newcastle | 168,880 | 165,541 | 18 | |||||
| 42 | Shire of Mornington Peninsula | 168,865 | 167,619 | 13 | |||||
| 43 | Cairns Region | 168,853 | 166,849 | 9 | |||||
| 44 | City of Kingston | 164,680 | 165,804 | 14 | |||||
| 45 | City of Greater Dandenong | 163,266 | 168,261 | 15 | |||||
| 46 | City of Knox | 162,769 | 164,553 | 16 | |||||
| 47 | City of Darebin | 162,501 | 164,224 | 17 | |||||
| 48 | Redland City | 161,463 | 158,801 | 10 | |||||
| 49 | City of Joondalup | 160,579 | 159,898 | 3 | |||||
| 50 | Georges River Council | 159,266 | 159,431 | 19 | |||||
How City Areas Are Defined
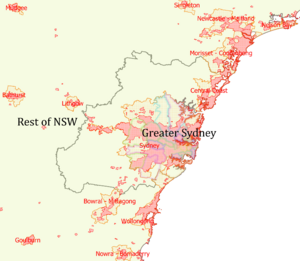
The map shows how the Australian Bureau of Statistics defines different areas around Sydney.
- The Greater Capital City Statistical Area (GCCSA) for Sydney is shown by the thick grey line. These are the eight largest areas that include each state or territory capital city. They are made up of one or more whole "labour market areas" (called SA4 units). The "Rest of NSW" area includes all other parts of New South Wales, as each state only has one GCCSA.
- The Significant Urban Areas (SUAs) are shown by solid orange lines with red text. These areas represent important towns and cities, or groups of smaller towns, that have populations of 10,000 people or more. They are made from smaller areas called SA2 units, which are collections of suburbs and localities.
- The Urban Centres/Localities are shown by dashed red lines with pink fill. These are the actual built-up parts of cities, towns, and smaller settlements. They are made from the smallest statistical areas, called SA1 units.
The map also shows 31 colored areas. These are the 31 local government areas that are generally considered to be part of Sydney, even if it's not an official definition.
See also
 In Spanish: Anexo:Ciudades de Australia por población para niños
- Demography of Australia
- List of cities in Australia
- List of cities in Oceania by population
- List of largest cities in the world
- List of places in New South Wales by population
- List of places in Queensland by population
- List of places in South Australia by population
- List of places in Tasmania by population
- List of places in Victoria by population
- List of places in Western Australia by population
- List of towns and cities in Australia by year of settlement
 | John T. Biggers |
 | Thomas Blackshear |
 | Mark Bradford |
 | Beverly Buchanan |


