City of Newcastle facts for kids
Quick facts for kids City of NewcastleNew South Wales |
|||||||||||||||
|---|---|---|---|---|---|---|---|---|---|---|---|---|---|---|---|

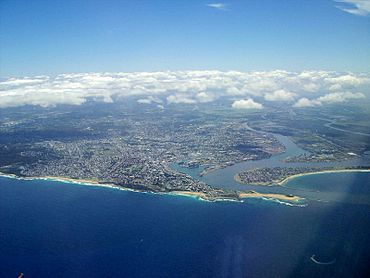
Aerial view of Newcastle
|
|||||||||||||||
| Population |
|
||||||||||||||
| • Density | 862.2/km2 (2,233/sq mi) | ||||||||||||||
| Area | 187 km2 (72.2 sq mi) | ||||||||||||||
| Time zone | AEST (UTC+10) | ||||||||||||||
| • Summer (DST) | AEDT (UTC+11) | ||||||||||||||
| Lord Mayor | Nuatali Nelmes (Labor) | ||||||||||||||
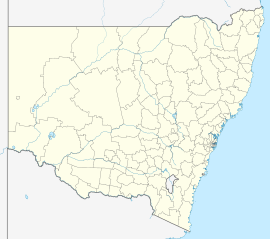
| Location | 162 km (101 mi) NNE of Sydney | ||||||||||||||
| Council seat | 12 Stewart Avenue, Newcastle | ||||||||||||||
| Region | Hunter | ||||||||||||||
| County | Northumberland | ||||||||||||||
| State electorate(s) |
|
||||||||||||||
| Federal Division(s) | |||||||||||||||
 |
|||||||||||||||
| Website | City of Newcastle | ||||||||||||||
|
|||||||||||||||
The City of Newcastle is a special area in New South Wales, Australia. It is managed by a local government. This government helps run the city of Newcastle. The area is located in the Hunter part of the state.
The main leader of the City of Newcastle Council is the Lord Mayor, Councillor Nuatali Nelmes. She is a politician from the Labor Party. Nuatali Nelmes was chosen as Lord Mayor in November 2014. This happened after the previous Lord Mayor, Jeff McCloy, resigned. The Council also respects the Awabakal and Worimi peoples. They are the original owners of the land and waters in Newcastle.
Contents
Council Mergers: A Big Idea
Sometimes, governments think about joining smaller areas together. This is called an amalgamation or merger. In 2015, the NSW Government looked at how local councils were doing. They thought the City of Newcastle Council might not be "fit for the future."
Plans for a New Council
Because of this, they suggested that the City of Newcastle should join with the Lake Macquarie City Council. Later, a different idea came up. The government suggested Newcastle join with Port Stephens Council instead. This new, bigger council would cover about 1,045 square kilometres. It would also serve around 230,000 people.
Decision Not to Merge
An independent review looked into these plans. By mid-2016, the review was finished. Then, in February 2017, the NSW Government made a final announcement. They decided not to go ahead with any more council mergers in the region. This included the plan for Newcastle City Council and Port Stephens Council to merge.
Who Lives in Newcastle?
It's interesting to learn about the people who live in the City of Newcastle. We can find this information from a special count called a census.
Population and Age
In the 2016 census, there were about 155,411 people living in the City of Newcastle. Almost half of them were male (49.3%) and just over half were female (50.7%). The average age of people in Newcastle was 37 years old. This is very close to the national average age of 38.
Children aged 0 to 14 years made up 16.9% of the population. People aged 65 years and older made up 16% of the population.
First Peoples and Growth
Aboriginal and Torres Strait Islander people made up 3.5% of Newcastle's population. This is a bit higher than the average for all of Australia.
The number of people living in Newcastle has grown over time. Between 2001 and 2006, the population grew by about 3.91%. From 2006 to 2016, it grew by 9.64%. This growth was a bit slower than the overall growth for Australia during the same times.
Where People Come From
Most people in the City of Newcastle were born in Australia. In 2016, over 80% of residents said they were born in Australia. This is much higher than the national average of 66.7%.
Languages and Beliefs
Most people in Newcastle speak English at home. Only about 11.6% of households speak a language other than English. This is lower than the national average.
Many people in Newcastle also have a religion. Almost 60% of residents said they had a religion in 2016. The most common religion was Catholicism, with almost 25% of people following it.
Sister Cities: Friends Around the World
The City of Newcastle has special friendships with other cities around the world. These are called sister city relationships. They help people from different places learn about each other's cultures.
- Ube, Yamaguchi, Japan (since 1980)
- Dubbo, New South Wales, Australia (since 1995)
- Arcadia, California, United States
 | Valerie Thomas |
 | Frederick McKinley Jones |
 | George Edward Alcorn Jr. |
 | Thomas Mensah |


