Port Stephens Council facts for kids
Quick facts for kids Port Stephens CouncilNew South Wales |
|||||||||||||||
|---|---|---|---|---|---|---|---|---|---|---|---|---|---|---|---|
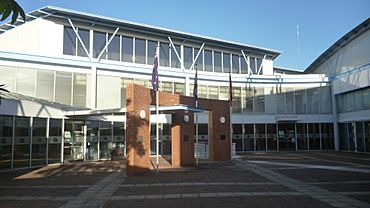
The Port Stephens Council chambers in Raymond Terrace, the council's centre of government
|
|||||||||||||||

Location in Greater Newcastle
|
|||||||||||||||
| Population |
|
||||||||||||||
| • Density | 76.89/km2 (199.1/sq mi) | ||||||||||||||
| Area | 979 km2 (378.0 sq mi) | ||||||||||||||
| Time zone | AEST (UTC+10) | ||||||||||||||
| • Summer (DST) | AEDT (UTC+11) | ||||||||||||||
| Mayor | Leah Anderson (Labor) | ||||||||||||||
| Location | |||||||||||||||
| Council seat | Raymond Terrace | ||||||||||||||
| Region | Hunter | ||||||||||||||
| State electorate(s) |
|
||||||||||||||
| Federal Division(s) | Paterson | ||||||||||||||
 |
|||||||||||||||
| Website | Port Stephens Council | ||||||||||||||
|
|||||||||||||||
Port Stephens Council is a local government area in the Hunter Region of New South Wales, Australia. A local government area is like a local council that manages services for a specific region. This area is located just north of Newcastle.
The Pacific Highway runs through Raymond Terrace, which is the largest town and the main office (seat) for the Council. The area gets its name from Port Stephens, a large natural harbour. The region stretches from the Hunter River in the south to near Clarence Town in the north. It goes from the Tasman Sea in the east to just south of Paterson in the west. Leah Anderson is the current mayor of Port Stephens Council. Port Stephens is about two and a half hours north of Sydney.
Towns and Suburbs
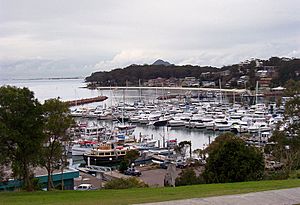
Most people in Port Stephens Council live in or around Raymond Terrace and its nearby suburb, Heatherbrae. Many also live near the beautiful shores of Port Stephens. These suburbs include Anna Bay, Boat Harbour, Corlette, Fingal Bay, Fishermans Bay, Karuah, Lemon Tree Passage, Mallabula, Nelson Bay, One Mile, Oyster Cove, Salamander Bay, Shoal Bay, Soldiers Point, Swan Bay, Tanilba Bay, and Taylors Beach.
Other people live in the rural (countryside) or semi-rural areas west of the Pacific Highway. These places include Balickera, Butterwick, Duns Creek, Eagleton, East Seaham, Glen Oak, Hinton, Nelsons Plains, Osterley, Seaham, Wallalong, Woodville, and the residential area of Brandy Hill.
In the southern part of the area, you'll find rural communities like Bobs Farm, Fern Bay, Fullerton Cove, Salt Ash, Tomago, and Williamtown. Tomago has both rural and industrial areas. Williamtown is home to a Royal Australian Air Force base, which shares its airfield with Newcastle Airport.
At the northern end of the area are Karuah and Twelve Mile Creek. Karuah is mostly residential and is next to Port Stephens and the Karuah River. It has the largest Aboriginal community in the area. Twelve Mile Creek is almost entirely rural.
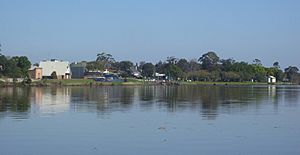
In the middle of the area, between Raymond Terrace and Port Stephens, are Campvale, Ferodale, and Medowie. Ferodale is known for Grahamstown Dam, a large man-made dam that holds a lot of fresh water for the region. The rest of this central area has a mix of rural, semi-rural, and residential developments.
Population and People
In 2011, there were about 64,807 people living in the Port Stephens local government area. About 3.6% of the population were Aboriginal and Torres Strait Islander people, which is a bit higher than the national average. The average age of people in Port Stephens was 42 years old, which is older than the national average of 37 years.
About 19.5% of the population were children aged 0-14 years, and 19.3% were people aged 65 and over. Most people (52%) aged 15 and over were married.
The population of Port Stephens Council has grown steadily over the years. Between 2001 and 2011, the population grew by about 7% in each five-year period. This growth was similar to the national average for Australia.
Most residents in Port Stephens Council (over 81%) have Australian or Anglo-Celtic ancestry. Over 63% of people identified with Christianity in 2011. Most households (92.2%) speak English only at home, which is higher than the national average.
Local Government
Port Stephens Council has ten councillors, including the mayor. They serve for a fixed four-year term. The Mayor is chosen directly by voters. The other nine councillors are elected from three different areas called "wards," with three councillors from each ward.
The most recent election was held on 14 September 2024. Here's how the Council is made up:
| Party | Councillors | |
|---|---|---|
| Labor | 5 | |
| Independent | 3 | |
| Liberal | 1 | |
| Independent National | 1 | |
| Total | 10 | |
The councillors elected in 2024 are:
| Ward | Councillor | Party | |
|---|---|---|---|
| Mayor | Leah Anderson | Labor | |
| East Ward | Nathan Errington | Liberal | |
| Roz Armstrong | Labor | ||
| Mark Watson | Independent | ||
| Central Ward | Chris Doohan | Independent | |
| Jason Wells | Labor | ||
| Ben Niland | Independent National | ||
| West Ward | Paul Le Mottee | Independent | |
| Giacomo Arnott | Labor | ||
| Peter Francis | Labor | ||
Proposed Merger with Newcastle
In 2015, the NSW Government looked at changing local government boundaries. Initially, Port Stephens Council was not part of any proposed mergers. However, after the Lake Macquarie City Council avoided merging with Newcastle City Council, the government then suggested that Newcastle City Council should merge with Port Stephens Council. This new council would cover a larger area and serve about 230,000 people.
Many residents strongly opposed this idea. Thousands of people attended rallies and signed petitions against the proposal. Local politicians and community leaders also spoke out against it. Port Stephens Council stated that 93% of its residents were against the merger. They even suggested merging with Dungog Shire instead.
After much discussion, the NSW government announced on 14 February 2017 that it would not go ahead with any more regional council mergers, including the one between Newcastle City Council and Port Stephens Council.
Getting Around: Transport
Port Stephens Coaches runs bus services within Port Stephens. They also provide bus routes to Newcastle and between Newcastle and Newcastle Airport. You can even take a daily coach service from Port Stephens to Central railway station in Sydney.
Newcastle Airport is located in Williamtown. It offers direct flights to many cities like Brisbane, Melbourne, Canberra, and the Gold Coast. Airlines like Virgin Australia, QantasLink, FlyPelican, and Jetstar operate from here.
The closest major train station to Port Stephens is Newcastle Interchange. From here, you can catch trains to Sydney, Maitland, and other towns in the Hunter region.
For travel between Nelson Bay and Tea Gardens, there is a ferry service called Port Stephens Ferry Service.
Climate
Port Stephens Council covers a large area of about 979 square kilometers. Because it's so big, it has different weather conditions across the region. These conditions are tracked by five weather stations. Four of these stations are located at the main compass points (east, north, south, west) of the area. The fifth station is at RAAF Base Williamtown.
The tables below show the average weather data for different parts of the Port Stephens area.
Eastern Climate
| Climate data for Nelson Head, Nelson Bay | |||||||||||||
|---|---|---|---|---|---|---|---|---|---|---|---|---|---|
| Month | Jan | Feb | Mar | Apr | May | Jun | Jul | Aug | Sep | Oct | Nov | Dec | Year |
| Record high °C (°F) | 36.5 (97.7) |
41.5 (106.7) |
36.0 (96.8) |
30.5 (86.9) |
26.7 (80.1) |
24.0 (75.2) |
24.4 (75.9) |
27.4 (81.3) |
34.2 (93.6) |
33.9 (93.0) |
40.6 (105.1) |
39.3 (102.7) |
41.5 (106.7) |
| Mean daily maximum °C (°F) | 27.3 (81.1) |
27.1 (80.8) |
25.9 (78.6) |
23.7 (74.7) |
20.8 (69.4) |
18.4 (65.1) |
17.5 (63.5) |
18.9 (66.0) |
21.4 (70.5) |
23.3 (73.9) |
24.8 (76.6) |
26.3 (79.3) |
23.0 (73.3) |
| Mean daily minimum °C (°F) | 18.2 (64.8) |
18.4 (65.1) |
17.0 (62.6) |
14.6 (58.3) |
11.7 (53.1) |
9.4 (48.9) |
8.4 (47.1) |
9.3 (48.7) |
11.2 (52.2) |
13.5 (56.3) |
15.2 (59.4) |
17.1 (62.8) |
13.7 (56.6) |
| Record low °C (°F) | 11.0 (51.8) |
14.5 (58.1) |
11.5 (52.7) |
9.0 (48.2) |
6.1 (43.0) |
4.4 (39.9) |
2.2 (36.0) |
1.1 (34.0) |
5.0 (41.0) |
8.5 (47.3) |
6.7 (44.1) |
9.0 (48.2) |
1.1 (34.0) |
| Average rainfall mm (inches) | 100.8 (3.97) |
111.3 (4.38) |
119.2 (4.69) |
126.7 (4.99) |
152.2 (5.99) |
153.1 (6.03) |
141.1 (5.56) |
105.5 (4.15) |
88.8 (3.50) |
78.3 (3.08) |
78.8 (3.10) |
95.0 (3.74) |
1,350.8 (53.18) |
Northern Climate
| Climate data for Wallaroo State Forest, Twelve Mile Creek | |||||||||||||
|---|---|---|---|---|---|---|---|---|---|---|---|---|---|
| Month | Jan | Feb | Mar | Apr | May | Jun | Jul | Aug | Sep | Oct | Nov | Dec | Year |
| Mean daily maximum °C (°F) | 28.3 (82.9) |
27.8 (82.0) |
26.5 (79.7) |
23.0 (73.4) |
19.8 (67.6) |
17.1 (62.8) |
16.4 (61.5) |
18.0 (64.4) |
21.2 (70.2) |
23.7 (74.7) |
26.2 (79.2) |
28.0 (82.4) |
23.0 (73.4) |
| Mean daily minimum °C (°F) | 16.3 (61.3) |
16.4 (61.5) |
14.8 (58.6) |
11.0 (51.8) |
7.4 (45.3) |
5.8 (42.4) |
3.6 (38.5) |
4.8 (40.6) |
6.7 (44.1) |
10.2 (50.4) |
12.4 (54.3) |
14.6 (58.3) |
10.3 (50.6) |
| Average rainfall mm (inches) | 124.8 (4.91) |
121.7 (4.79) |
142.6 (5.61) |
100.0 (3.94) |
99.7 (3.93) |
118.7 (4.67) |
63.4 (2.50) |
68.1 (2.68) |
58.2 (2.29) |
79.7 (3.14) |
83.0 (3.27) |
90.6 (3.57) |
1,150.5 (45.3) |
South-Central Climate
| Climate data for RAAF Base Williamtown | |||||||||||||
|---|---|---|---|---|---|---|---|---|---|---|---|---|---|
| Month | Jan | Feb | Mar | Apr | May | Jun | Jul | Aug | Sep | Oct | Nov | Dec | Year |
| Record high °C (°F) | 44.4 (111.9) |
42.8 (109.0) |
40.7 (105.3) |
37.0 (98.6) |
29.6 (85.3) |
26.6 (79.9) |
27.8 (82.0) |
30.1 (86.2) |
36.0 (96.8) |
39.4 (102.9) |
43.2 (109.8) |
42.8 (109.0) |
44.4 (111.9) |
| Mean daily maximum °C (°F) | 27.9 (82.2) |
27.5 (81.5) |
26.2 (79.2) |
23.7 (74.7) |
20.2 (68.4) |
17.6 (63.7) |
17.0 (62.6) |
18.6 (65.5) |
21.2 (70.2) |
23.6 (74.5) |
25.4 (77.7) |
27.2 (81.0) |
23.0 (73.4) |
| Mean daily minimum °C (°F) | 18.0 (64.4) |
18.1 (64.6) |
16.3 (61.3) |
13.2 (55.8) |
10.1 (50.2) |
7.8 (46.0) |
6.4 (43.5) |
6.9 (44.4) |
9.0 (48.2) |
12.0 (53.6) |
14.2 (57.6) |
16.5 (61.7) |
12.4 (54.3) |
| Record low °C (°F) | 9.4 (48.9) |
9.6 (49.3) |
8.6 (47.5) |
2.1 (35.8) |
−0.6 (30.9) |
0.0 (32.0) |
−3.9 (25.0) |
−1.9 (28.6) |
0.4 (32.7) |
3.0 (37.4) |
5.1 (41.2) |
7.9 (46.2) |
−3.9 (25.0) |
| Average rainfall mm (inches) | 99.9 (3.93) |
121.4 (4.78) |
121.7 (4.79) |
104.2 (4.10) |
115.0 (4.53) |
121.0 (4.76) |
71.6 (2.82) |
78.1 (3.07) |
59.4 (2.34) |
74.5 (2.93) |
80.9 (3.19) |
80.0 (3.15) |
1,127.7 (44.39) |
Western Climate
| Climate data for Tocal Automatic Weather Station (AWS), Tocal | |||||||||||||
|---|---|---|---|---|---|---|---|---|---|---|---|---|---|
| Month | Jan | Feb | Mar | Apr | May | Jun | Jul | Aug | Sep | Oct | Nov | Dec | Year |
| Record high °C (°F) | 43.7 (110.7) |
44.6 (112.3) |
41.2 (106.2) |
37.3 (99.1) |
29.5 (85.1) |
26.1 (79.0) |
27.3 (81.1) |
30.4 (86.7) |
36.2 (97.2) |
40.1 (104.2) |
42.5 (108.5) |
— | 44.6 (112.3) |
| Mean daily maximum °C (°F) | 29.6 (85.3) |
28.8 (83.8) |
26.9 (80.4) |
24.3 (75.7) |
20.7 (69.3) |
17.7 (63.9) |
17.3 (63.1) |
19.3 (66.7) |
22.2 (72.0) |
24.9 (76.8) |
26.6 (79.9) |
29.1 (84.4) |
24.0 (75.1) |
| Mean daily minimum °C (°F) | 17.5 (63.5) |
17.5 (63.5) |
15.6 (60.1) |
12.4 (54.3) |
9.7 (49.5) |
7.4 (45.3) |
6.1 (43.0) |
6.6 (43.9) |
8.8 (47.8) |
11.4 (52.5) |
13.8 (56.8) |
16.2 (61.2) |
11.9 (53.5) |
| Record low °C (°F) | 8.6 (47.5) |
9.4 (48.9) |
8.0 (46.4) |
1.3 (34.3) |
0.5 (32.9) |
0.2 (32.4) |
−4.7 (23.5) |
−1.5 (29.3) |
−0.6 (30.9) |
3.4 (38.1) |
5.3 (41.5) |
6.2 (43.2) |
−4.7 (23.5) |
| Average rainfall mm (inches) | 108.5 (4.27) |
116.3 (4.58) |
118.1 (4.65) |
76.4 (3.01) |
76.8 (3.02) |
71.1 (2.80) |
39.3 (1.55) |
37.9 (1.49) |
47.8 (1.88) |
67.3 (2.65) |
81.5 (3.21) |
78.2 (3.08) |
919.2 (36.19) |
Southern Climate
| Climate data for Nobbys Signal Station AWS, Newcastle | |||||||||||||
|---|---|---|---|---|---|---|---|---|---|---|---|---|---|
| Month | Jan | Feb | Mar | Apr | May | Jun | Jul | Aug | Sep | Oct | Nov | Dec | Year |
| Record high °C (°F) | 41.4 (106.5) |
40.9 (105.6) |
39.0 (102.2) |
36.8 (98.2) |
28.5 (83.3) |
26.1 (79.0) |
26.3 (79.3) |
29.9 (85.8) |
34.4 (93.9) |
36.7 (98.1) |
41.0 (105.8) |
42.0 (107.6) |
42.0 (107.6) |
| Mean daily maximum °C (°F) | 25.5 (77.9) |
25.4 (77.7) |
24.7 (76.5) |
22.8 (73.0) |
20.0 (68.0) |
17.5 (63.5) |
16.7 (62.1) |
18.0 (64.4) |
20.2 (68.4) |
22.1 (71.8) |
23.5 (74.3) |
24.9 (76.8) |
21.8 (71.2) |
| Mean daily minimum °C (°F) | 19.2 (66.6) |
19.3 (66.7) |
18.2 (64.8) |
15.3 (59.5) |
12.0 (53.6) |
9.6 (49.3) |
8.4 (47.1) |
9.2 (48.6) |
11.4 (52.5) |
14.0 (57.2) |
16.1 (61.0) |
18.0 (64.4) |
14.2 (57.6) |
| Record low °C (°F) | 12.0 (53.6) |
10.3 (50.5) |
11.1 (52.0) |
7.4 (45.3) |
4.7 (40.5) |
3.0 (37.4) |
1.8 (35.2) |
3.3 (37.9) |
5.0 (41.0) |
6.5 (43.7) |
7.2 (45.0) |
11.0 (51.8) |
1.8 (35.2) |
| Average rainfall mm (inches) | 89.5 (3.52) |
108.0 (4.25) |
120.8 (4.76) |
116.6 (4.59) |
118.0 (4.65) |
117.5 (4.63) |
95.0 (3.74) |
75.1 (2.96) |
73.0 (2.87) |
73.2 (2.88) |
70.5 (2.78) |
81.8 (3.22) |
1,139 (44.85) |
Climate Action
In 2020, Port Stephens Council created a plan to deal with climate change. They joined the Cities Power Partnership, a group that helps cities take action on climate. The Council knows that Australia's climate is changing and that we need to work towards a sustainable future.
The Council's plan focuses on three main areas:
- Education: Helping local people and businesses understand climate change risks and how to manage them.
- Mitigation: Reducing things that cause climate change.
- Adaptation: Learning to live with the changes that are already happening.
The Council is working to:
- Talk with residents and businesses to raise awareness about climate change.
- Get ideas from the community on how to manage climate change risks.
- Create a plan to show their actions, goals, and how well they are doing.
- Reduce their own impact on climate change through various projects.
- Keep their Climate Change Adaptation Action Plan updated.
- Share their progress in managing climate change risks regularly.
- Look for ways to get money to support their climate projects.
By 2025, the Council aims to be carbon neutral in its own operations. This means they want to balance the amount of carbon they release with the amount they remove. They have already installed solar panels, LED lights, and special controllers in some council buildings to save energy and money. They even used recycled glass in a new roundabout, which is a first for the region!
The Council is studying its current carbon emissions and plans to create a "roadmap" to become carbon neutral. However, they have not yet declared a climate emergency or created a detailed plan for the whole community's emissions.
Climate Action Port Stephens (CAPS) is a community group started in 2019. They are concerned about climate change and want real action in the community. CAPS has asked the Council to declare a climate emergency. CAPS is also part of EcoNetwork Port Stephens, a volunteer group founded in 1993 that works to protect nature and the environment.
Sister Cities
Port Stephens has special "sister city" relationships with other cities around the world. These relationships help promote friendship and understanding.
 Bellingham, Washington, United States (since 1982)
 Kushiro, Hokkaidō, Japan (since 1994)
 Tateyama, Chiba, Japan (Friendship Cities from 1999–2009, sister cities since 2009)
 Yugawara, Kanagawa, Japan (Since 1999)
 | Anna J. Cooper |
 | Mary McLeod Bethune |
 | Lillie Mae Bradford |


