Image: Table isotopes en

Size of this PNG preview of this SVG file: 419 × 600 pixels. Other resolution: 168 × 240 pixels.
Original image (SVG file, nominally 580 × 830 pixels, file size: 215 KB)
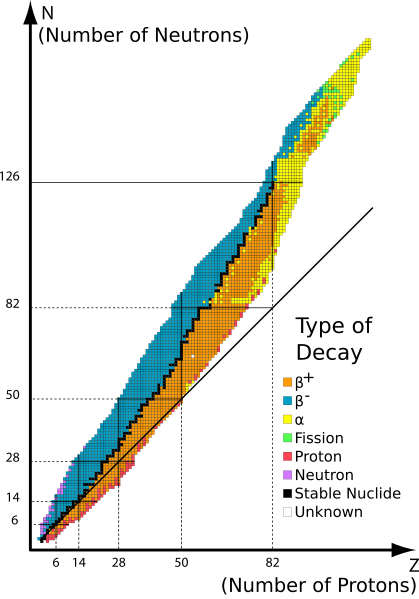
Description: Graph of isotopes by type of nuclear decay. Orange and blue nuclides are unstable, with the black squares between these regions representing stable nuclides. The unbroken line passing below many of the nuclides represents the theoretical position on the graph of nuclides for which proton number is the same as neutron number. The graph shows that elements with more than 16 protons must have more neutrons than protons, in order to be stable.
Author: Table_isotopes.svg: Napy1kenobi derivative work: Sjlegg (talk)
Usage Terms: Creative Commons Attribution-Share Alike 3.0
License: CC-BY-SA-3.0
License Link: http://creativecommons.org/licenses/by-sa/3.0/
Attribution Required?: Yes
Image usage
The following page links to this image:

All content from Kiddle encyclopedia articles (including the article images and facts) can be freely used under Attribution-ShareAlike license, unless stated otherwise.
