
Image: Taro2009

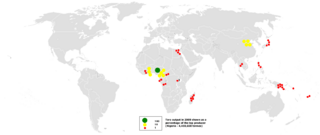
Description: This bubble map shows the global distribution of taro output in 2009 as a percentage of the top producer (Nigeria - 4,459,650 tonnes). This map is consistent with incomplete set of data too as long as the top producer is known. It resolves the accessibility issues faced by colour-coded maps that may not be properly rendered in old computer screens. Data was extracted on 7th November 2011 from http://faostat.fao.org/site/336/DesktopDefault.aspx?PageID=336 Based on en::Image:BlankMap-World.png
Title: Taro2009
Credit: http://en.wikipedia.org/wiki/File:2005cottonseed.PNG
Author: Anwar saadat
Usage Terms: Creative Commons Zero, Public Domain Dedication
License: CC0
License Link: http://creativecommons.org/publicdomain/zero/1.0/deed.en
Attribution Required?: No
Image usage
The following page links to this image:
