
Image: Temperature Bar Chart Europe-Monaco--1901-2020--2021-07-13

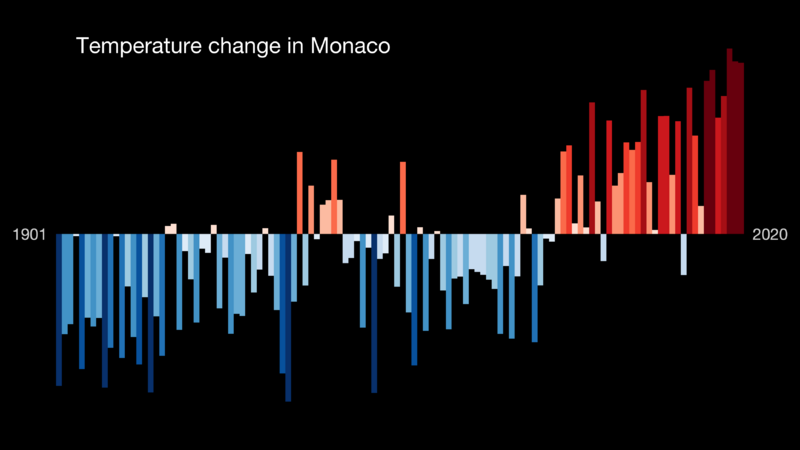
Description: This bar chart is a visual representation of the change in temperature in the past 100+ years. Each stripe represents the temperature averaged over a year. The average temperature in 1971–2000 is set as the boundary between blue and red colors, and the color scale varies from ±2.6 standard deviations of the annual average temperatures between the years mentioned in the file name. Data source: Berkeley Earth. For more information visit https://showyourstripes.info/faq
Title: Temperature Bar Chart Europe-Monaco--1901-2020--2021-07-13
Credit: https://showyourstripes.info/
Author: Ed Hawkins, University of Reading
Usage Terms: Creative Commons Attribution 4.0
License: CC BY 4.0
License Link: https://creativecommons.org/licenses/by/4.0
Attribution Required?: Yes
Image usage
The following page links to this image:
