
Image: Total CO2 by Region
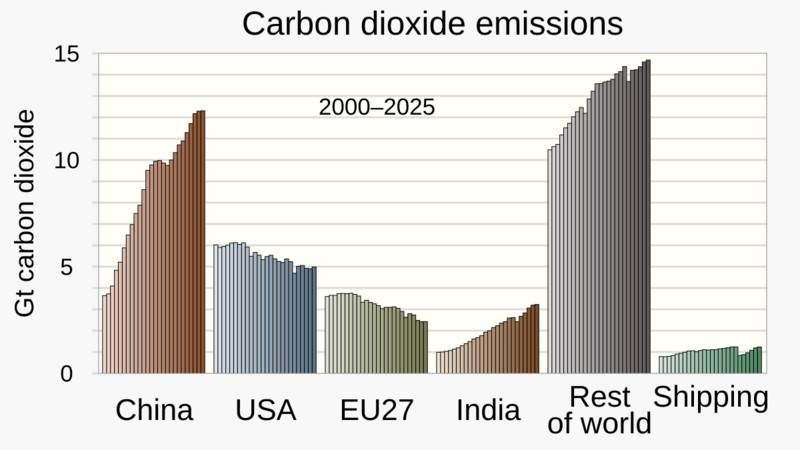
Description: Chart showing carbon dioxide emissions by region over time. Sourcing for Version 13 (19 March 2026; data updated through 2025): GCB 2025. Global Carbon Budget (2026). Archived from the original on 8 February 2026. GCB links to downloadable data at Figures from the Global Carbon Budget 2025 / 73: Global CO2 emissions by region. CICERO Center for International Climate Research (2026). Archived from the original on 1 March 2026. Technical note: SVG code for each of the six column charts in Version 13 was automatically generated by the "Vertical bar charts (column charts)" spreadsheet linked at User:RCraig09/Excel to XML for SVG. Additions and adjustments were made in a text editor. Re Version 1: The trend since 2015 is also highlighted in this adaptation of a chart from the Global Carbon Project. The specific source is [1] (distributed under Creative Commons Attribution 4.0 License), based primarily on the image "Global CO2 emissions by region", with russian data aggregated in.
This SVG file contains embedded text that can be translated into your language, using any capable SVG editor, text editor or the SVG Translate tool. For more information see: About translating SVG files.
Author: Efbrazil for Version 1, and User:RCraig09 for Version 13
Usage Terms: Creative Commons Attribution-Share Alike 3.0
License: CC-BY-SA-3.0
License Link: http://creativecommons.org/licenses/by-sa/3.0/
Attribution Required?: Yes
Image usage
The following page links to this image:
