
Image: Uneconomic Growth diagram
Size of this preview: 616 × 599 pixels. Other resolutions: 247 × 240 pixels | 1,024 × 996 pixels.
Original image (1,024 × 996 pixels, file size: 56 KB, MIME type: image/jpeg)
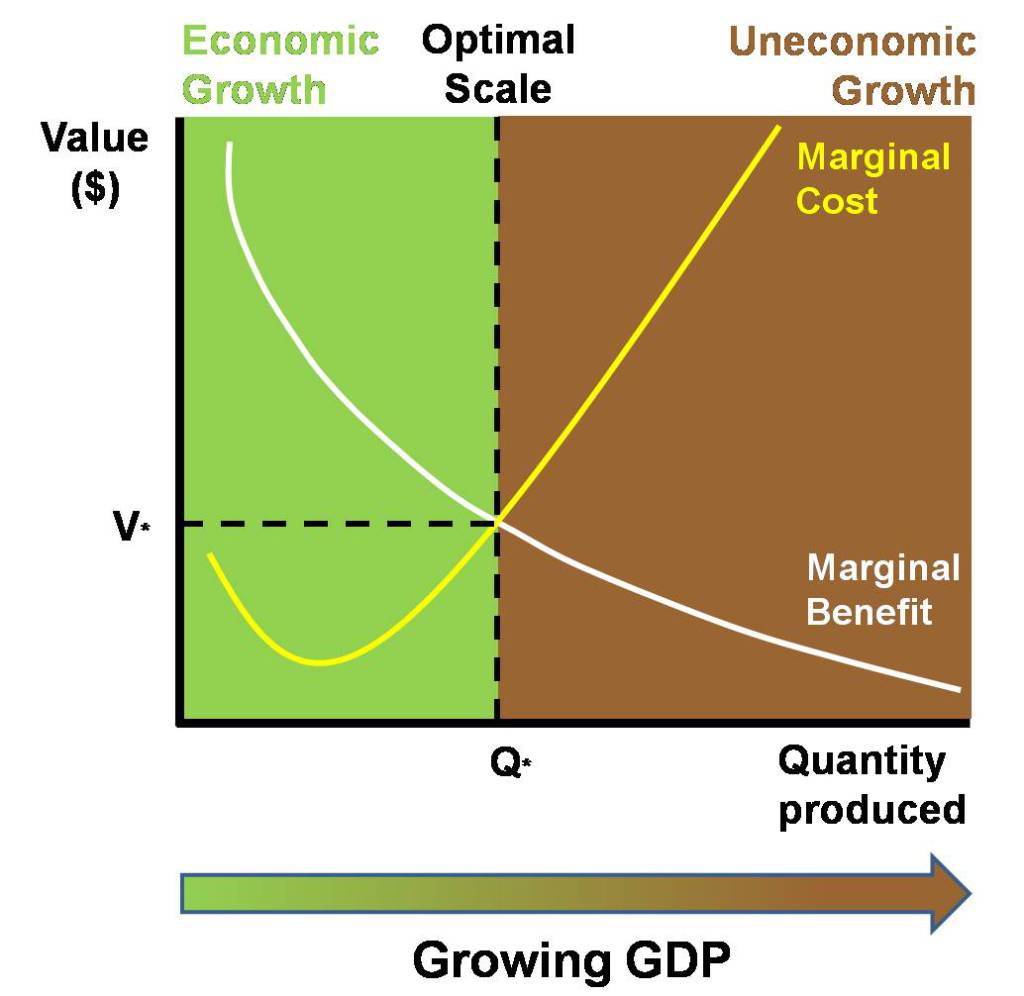
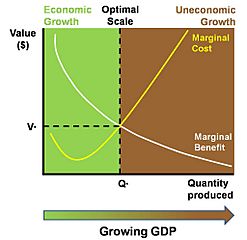
Description: Diagram showing the marginal costs of a growing economy gradually exceeding the marginal benefits, eventually resulting in 'uneconomic growth'. The optimal scale of the economy Q* is where costs equal benefits at V*, marking the divide between the 'economic' green part of the diagram to the left and the 'uneconomic' brown part to the right.
Title: Uneconomic Growth diagram
Credit: http://www.steadystate.org/discover/downsides-of-economic-growth
Author: Center for the Advancement of the Steady State Economy
Usage Terms: Creative Commons Attribution 3.0
License: CC BY 3.0
License Link: https://creativecommons.org/licenses/by/3.0
Attribution Required?: Yes
Image usage
The following 2 pages link to this image:

All content from Kiddle encyclopedia articles (including the article images and facts) can be freely used under Attribution-ShareAlike license, unless stated otherwise.