
Image: WMAP 2008 94GHz foregrounds
Size of this preview: 800 × 400 pixels. Other resolutions: 320 × 160 pixels | 2,048 × 1,024 pixels.
Original image (2,048 × 1,024 pixels, file size: 810 KB, MIME type: image/png)
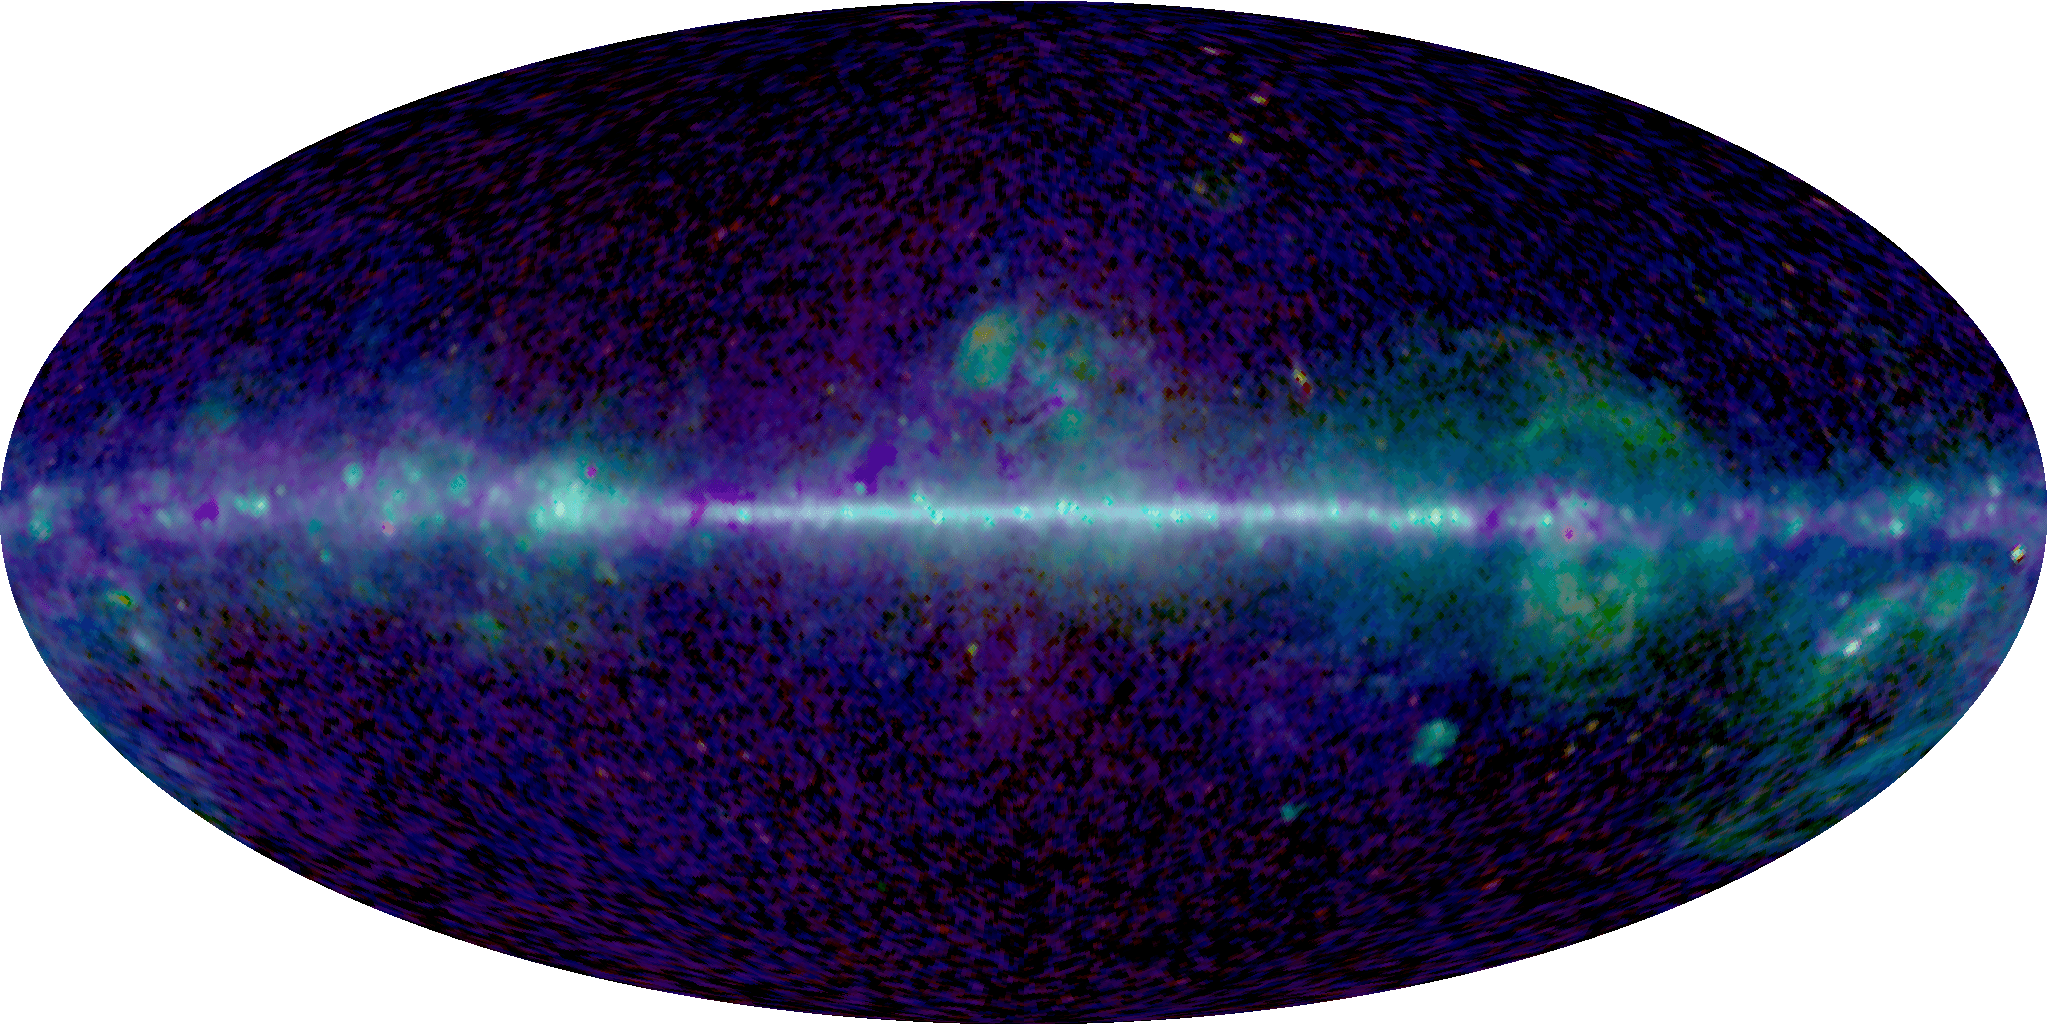
Description: "Three-color maps from the Maximum Entropy Method (MEM) model for the 5 WMAP frequency bands. These maps indicate which emission mechanism dominates as a function of frequency and sky position. Synchrotron is red, free-free is green, and thermal dust is blue." W-Band Map (94 GHz), logarithmic scale.
Title: WMAP 2008 94GHz foregrounds
Credit: LAMBDA WMAP Images; [1]
Author: NASA / WMAP Science Team
Usage Terms: Public domain
License: Public domain
Attribution Required?: No
Image usage
The following page links to this image:

All content from Kiddle encyclopedia articles (including the article images and facts) can be freely used under Attribution-ShareAlike license, unless stated otherwise.