
Wilkinson Microwave Anisotropy Probe facts for kids

Wilkinson Microwave Anisotropy Probe (WMAP) satellite
|
|
| Names | Explorer 80 MAP Microwave Anisotropy Probe MIDEX-2 WMAP |
|---|---|
| Mission type | Cosmic microwave background Astronomy |
| Operator | NASA |
| Website | http://map.gsfc.nasa.gov/ |
| Mission duration | 27 months (planned) 9 years (achieved) |
| Spacecraft properties | |
| Spacecraft | Explorer LXXX |
| Spacecraft type | Wilkinson Microwave Anisotropy Probe |
| Bus | WMAP |
| Manufacturer | NRAO |
| Launch mass | 840 kg (1,850 lb) |
| Dry mass | 763 kg (1,682 lb) |
| Dimensions | 3.6 × 5.1 m (12 × 17 ft) |
| Power | 419 watts |
| Start of mission | |
| Launch date | 30 June 2001, 19:46:46 UTC |
| Rocket | Delta II 7425-10 (Delta 246) |
| Launch site | Cape Canaveral, SLC-17B |
| Contractor | Boeing Launch Services |
| Entered service | 1 October 2001 |
| End of mission | |
| Disposal | Graveyard orbit |
| Deactivated | 20 October 2010 |
| Last contact | 19 August 2010 |
| Orbital parameters | |
| Reference system | L2 point |
| Regime | Lissajous orbit |
| Main telescope | |
| Type | Gregorian |
| Diameter | 1.4 × 1.6 m (4 ft 7 in × 5 ft 3 in) |
| Wavelengths | 23 GHz to 94 GHz |
 Wilkinson Microwave Anisotropy Probe mission patch Explorer program
|
|
The Wilkinson Microwave Anisotropy Probe (WMAP) was a special NASA spacecraft. It worked from 2001 to 2010. Its main job was to measure tiny temperature differences across the sky. These differences are found in the cosmic microwave background (CMB). The CMB is like a leftover glow from the Big Bang, which was the beginning of our universe.
WMAP was first called the Microwave Anisotropy Probe (MAP). It was part of NASA's Explorer program. In 2003, it was renamed WMAP to honor David Todd Wilkinson. He was a scientist who helped with the mission. WMAP was turned off in 2010. This happened after the Planck spacecraft, an even more advanced mission, was launched by the European Space Agency (ESA).
WMAP's measurements were super important. They helped scientists create the best model we have for how the universe works. This model is called the Lambda-CDM model. WMAP showed that our universe is mostly made of something called dark energy. It also has a lot of cold dark matter. These are things we can't see or touch.
Thanks to WMAP, we know the age of the universe very precisely. It's about 13.77 billion years old! WMAP also helped us understand what the universe is made of today. It's about 4.6% ordinary matter (like us and everything we see). About 24% is cold dark matter, and about 71% is dark energy. Dark energy is what makes the universe expand faster and faster.
WMAP received many awards for its amazing discoveries. Science magazine called it the Breakthrough of the Year for 2003. Many of its research papers are among the most referenced in physics and astronomy.
After nine years of work, WMAP was moved to a special "graveyard orbit" in space. All the information WMAP collected has been shared with the public. The final set of data was released in 2012.
Some of WMAP's findings are a bit unusual. For example, a very large "cold spot" was found in the data. Scientists are still studying these interesting features.
Contents
Why WMAP Was Important


The main goal of WMAP was to measure tiny temperature differences in the Cosmic Microwave Background (CMB) radiation. By studying these differences, scientists could learn about:
- The shape of the universe.
- What the universe is made of.
- How the universe has changed over time.
- How well the Big Bang model works.
- If the idea of cosmic inflation is true.
To do this, WMAP made a full map of the CMB across the entire sky. It had a very good resolution, meaning it could see small details. The map was made by observing the sky at different radio frequencies. This helped make sure the map was very accurate. The map has over 3 million pixels, like a giant digital image of the early universe. WMAP also measured something called E-mode polarization in the CMB. This tells us about how light waves are oriented.
The mission was planned to last 27 months. This included 3 months to reach its special spot in space and 2 years of observations.
How WMAP Was Built


The idea for the MAP mission was first suggested to NASA in 1995. It was approved for development in 1997.
Before WMAP, two other missions looked at the CMB. The Soviet RELIKT-1 gave some early measurements. Then, the U.S. COBE satellite first found large changes in the CMB. WMAP was much better than COBE. It was 45 times more sensitive and could see 33 times more detail. The Planck mission, which came after WMAP, was even more sensitive and had higher resolution.
WMAP's main mirrors were two large dishes, about 1.4 by 1.6 meters in size. They faced in opposite directions. These mirrors focused the signals onto smaller secondary mirrors. The mirrors were made of a special carbon fiber material. They were coated with aluminum and silicon oxide. These secondary mirrors sent the signals to special antennas called feedhorns.
The spacecraft had special receivers called radiometers. These measured the difference between two telescope beams. This helped them detect tiny changes in the sky's signal. WMAP used five different radio frequencies. This helped it remove signals from our own Milky Way galaxy.
WMAP's base was a large, 5-meter-wide solar panel array. This array kept the instruments in shadow while they observed the CMB. The spacecraft had warm parts and cold parts. The cold parts, like the mirrors, were kept separate from the warm parts. This was done using a special thermal shell.
WMAP was cooled to about -183 degrees Celsius (90 Kelvin) using special radiators. The telescope used 419 watts of power. Its temperature was checked with special thermometers.
To make sure its data was correct, WMAP used the CMB dipole and measurements of Jupiter. The telescope sent its data to Earth every day. It used a special radio signal to send information to a large antenna on Earth. The spacecraft kept its position using special wheels, gyroscopes, and sensors. It also had small thrusters that used hydrazine fuel.
Journey to Space


The WMAP spacecraft arrived at the Kennedy Space Center in Florida on April 20, 2001. After two months of testing, it launched on June 30, 2001. It was carried into space by a Delta II rocket.
WMAP started working right after launch. It spent some time testing its systems. Then, it flew past the Moon on July 30, 2001. Its destination was a special spot in space called the Sun-Earth L2 point. It arrived there on October 1, 2001. WMAP was the first CMB mission to be placed at this location.
Being at the L2 point, which is about 1.5 million kilometers from Earth, helped keep WMAP stable. It also helped minimize interference from the Sun, Earth, and Moon. To see the entire sky, WMAP orbited around the L2 point. It rotated once every 2 minutes and 9 seconds. This allowed it to scan the whole sky every six months. WMAP completed its first full-sky observation in April 2002.
-
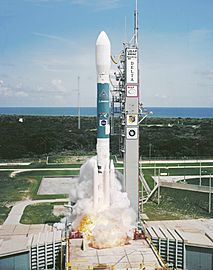
WMAP launches from Kennedy Space Center, 30 June 2001
-
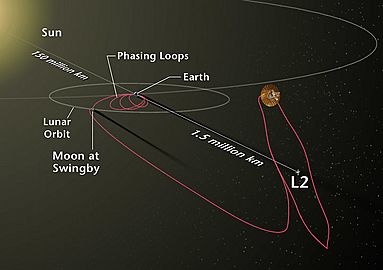
The WMAP's trajectory and orbit
-
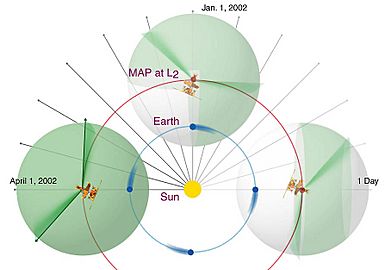
WMAP's orbit and sky scan strategy


How WMAP Collected Data
WMAP used special instruments called pseudo-correlation differential radiometers. These were fed by its two large mirrors. The instrument used five different radio frequencies, from 22 GHz to 90 GHz. This helped it remove unwanted signals from our own galaxy. WMAP had a wide field of view (FoV) of 3.5° x 3.5°.
Removing Other Signals
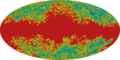
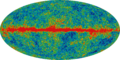
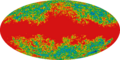
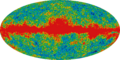
WMAP observed the sky at five different frequencies. This was important because it allowed scientists to separate the CMB signal from other "foreground" signals. These foreground signals come from things like our own Milky Way galaxy and other galaxies.
The main types of unwanted signals are:
- Synchrotron radiation and free-free emission: These are strong at lower frequencies.
- Astrophysical dust emissions: These are strong at higher frequencies.
Because these signals have different properties at different frequencies, WMAP could identify and remove them. Scientists used several methods to do this. They subtracted existing maps of these emissions. They also used the known properties of these emissions to identify them. Sometimes, they would even mask out parts of the sky that had too much foreground contamination.
 |
 |
 |
 |
 |
| 23 GHz | 33 GHz | 41 GHz | 61 GHz | 94 GHz |
WMAP's Big Discoveries
WMAP's mission led to many important discoveries about our universe. Scientists released data in several stages, each time giving us a clearer picture.
First Year of Data

On February 11, 2003, NASA shared WMAP's first year of data. This included new information about the age and makeup of the early universe. They also released an image of the early universe. This image was so detailed that it was called one of the most important scientific results in years.
Based on this data, scientists confirmed that the universe is about 13.7 billion years old. They also found that the universe is made of:
- About 4.6% ordinary matter (like stars, planets, and us).
- About 24% cold dark matter (a mysterious substance that doesn't interact with light).
- About 71% dark energy (which causes the universe to expand faster).
WMAP's data also showed that the universe has a "flat geometry." This means that if you could draw a giant triangle in space, its angles would add up to 180 degrees, just like on a flat piece of paper. This finding supported the idea of cosmic inflation, a theory about how the universe expanded very quickly right after the Big Bang.
Nine Years of Data

On December 29, 2012, the final nine-year WMAP data was released. This included the most precise image of the CMB yet. The image showed tiny temperature changes, only about ± 200 microkelvins. These changes are like ripples from the very early universe.
This final study confirmed that the universe is 13.772 billion years old. It also showed that 95% of the early universe was made of dark matter and dark energy. The data also suggested that the universe became clear (emerged from the "cosmic Dark Ages") about 400 million years after the Big Bang.
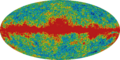
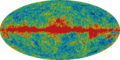
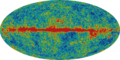
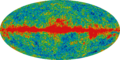
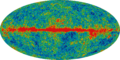
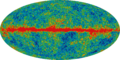
What the Maps Show
The main result of the WMAP mission is shown in the oval maps of the CMB temperature differences. These maps show the temperature distribution across the entire sky. They represent a snapshot of the universe when it was only about 375,000 years old. This was long before stars and galaxies formed.
The microwave background is incredibly smooth in temperature. The differences are very, very tiny. The average temperature today is about 2.7 Kelvin (about -270 degrees Celsius). The maps show variations of only about 5 parts in 100,000. The different colors on the map show these tiny temperature changes. Red areas are slightly hotter than average, and blue areas are slightly cooler.
What Came After WMAP

WMAP was originally planned for two years of observations. But it did so well that its mission was extended several times. It ended up observing for a total of nine years, finishing in August 2010. In October 2010, the spacecraft was moved to a special "graveyard orbit" around the Sun.
The Planck spacecraft was launched by the European Space Agency in 2009. It also measured the CMB from 2009 to 2013. Planck was designed to make even more precise measurements than WMAP. It looked at the sky in more frequency bands, which helped it get an even clearer picture.
Many other telescopes on the ground and in balloons have also studied the CMB. Future missions are being built to look for a special type of polarization called B-mode polarization. This could give us even more clues about the very first moments of the universe.
On March 21, 2013, the Planck team released their all-sky map of the CMB. This map suggested that the universe is slightly older than previously thought. It showed tiny ripples in the early universe that later grew into the large structures we see today, like galaxy clusters and the cosmic web of dark matter. Based on Planck's 2013 data, the universe is made of about 4.9% ordinary matter, 26.8% dark matter, and 68.3% dark energy. Later, in 2015, new Planck data refined the age of the universe to 13.799 billion years.
See also
 In Spanish: WMAP para niños
- Explorer program
- List of cosmic microwave background experiments
- NASA space probes
- Space telescopes
Images for kids
-
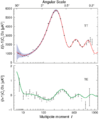
The five-year total-intensity and polarization spectra from WMAP
-

Matter/energy content in the current universe (top) and at the time of photon decoupling in the recombination epoch 380,000 years after the Big Bang (bottom)
-
23-GHz
-
33-GHz
-
41-GHz
-
61-GHz
-
94-GHz
-
23-GHz
-
33-GHz
-
41-GHz
-
61-GHz
-
94-GHz


