
Interpolation facts for kids
When scientists, engineers, or even artists collect information, they often get specific measurements, like dots on a graph. These separate measurements are called data points. Sometimes, to understand the information better, it's helpful to connect these dots with a smooth line or curve.
The process of "filling in the gaps" or guessing the values between two known data points is called interpolation. It helps us create a continuous line from separate points. There are many ways to do this, from drawing simple straight lines to using more complex mathematical curves called polynomials. Even if some of the original data is a bit off, interpolation can still give us useful results. It can help replace missing information or make complicated data easier to understand.
Interpolation is different from extrapolation. While interpolation finds values between known points, extrapolation tries to guess values outside the known points.
Contents
Why We Use Interpolation
Interpolation is used by many people, like scientists, photographers, and engineers, to figure out what data might exist beyond what they've already collected. It's especially helpful in two main areas: making images bigger and making computer calculations faster.
Making Images Bigger
Have you ever tried to make a small picture much larger? If you just stretch the existing pixels (the tiny dots that make up an image), the picture would look blurry or blocky. Instead, computer programs use interpolation to create new pixels.
Here's how it works:
- First, the program spreads out the original pixels, leaving empty spaces.
- Then, it looks at the existing pixels around these empty spaces.
- Using this information, it "guesses" what the new pixels should look like to fill the gaps.
- This creates a new, larger image that looks smoother.
Sometimes, the program might guess wrong, and the enlarged image can look a little blurry or strange in some spots. These are called interpolation errors. But usually, the image still looks similar to the original, just bigger. This shows both the good and bad sides of interpolation: you can see new data, but it might not be perfect.
Making Calculations Faster
In science, sometimes a computer needs to solve a very complex math problem or calculate a difficult function. This can take a lot of time and computer power. To speed things up, scientists might use interpolation.
They can create a slightly simpler version of the complex function using interpolation. This new, "interpolated" function takes less time and energy for the computer to run. It might not be perfectly accurate compared to the original, super-complex function, and it might lose a tiny bit of detail. However, the time and cost saved by using the simpler function often make this small trade-off worthwhile for their experiments.
Gallery
-
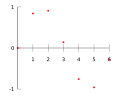
Sample measurements, like those from an experiment.
-

Piecewise constant interpolation, also known as nearest-neighbor interpolation.
-

Using straight lines to find values between two points; this is called linear interpolation.
-
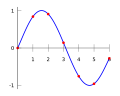
Using a polynomial (a type of curve) to interpolate.
-
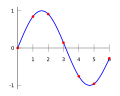
Using a spline (a flexible curve) to interpolate.
-

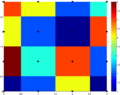
Interpolation can also be used to resize an image.


You can learn more about how interpolation is used in graphics and photography here: [1]
Images for kids
-
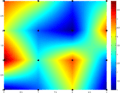
Nearest neighbor
-
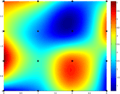
Bilinear
-
Bicubic


See also
 In Spanish: Interpolación para niños
