
Sample size determination facts for kids
Sample size determination is all about figuring out how many people or things you need to study to get a good idea about a larger group. Imagine you want to know how many students in your whole school like pizza. You can't ask everyone, so you pick a smaller group, a "sample." The size of this sample is super important for any study where you want to learn about a big group from a small one.
Often, the number of people or things you study depends on things like how much money you have, how much time, or how easy it is to collect the information. But it also needs to be enough to give you reliable results. For example, if you're doing a big survey, you might need different sample sizes for different groups of people. If you try to ask everyone in a group, like in a school census, then your sample size is the whole group!
You can choose your sample size in a few ways:
- Using experience: Sometimes, you might just guess based on past studies. But if your sample is too small, your results might not be very accurate.
- Aiming for accuracy: If you want your results to be super precise, you'll need a larger sample.
- Planning for strong tests: If you're testing an idea, you want your sample to be big enough to clearly show if your idea is right or wrong.
- Choosing a confidence level: This is about how sure you want to be that your results are correct. The more confident you want to be, the bigger your sample size needs to be.
Contents
Why Sample Size Matters
Having a larger sample usually helps you get more accurate results when you're trying to figure out unknown numbers. For example, if you want to know what percentage of a certain type of fish has a specific illness, you'd get a much better idea if you checked 200 fish instead of just 100. This is because of big ideas in math like the law of large numbers, which basically says that as you get more data, your average result gets closer to the real average.
Sometimes, even with a huge sample, your results might not get much more accurate. This can happen if there are hidden problems with how the data was collected or if the data itself is unusual.
We can check how good a sample size is by looking at how accurate the results are. For instance, if you're trying to estimate a percentage, you might want to be 95% sure that your answer is very close to the real one. Or, if you're comparing two groups, you might want to be 80% sure you can spot a real difference between them.
Estimating Numbers from Samples
Estimating a Percentage
Let's say you want to guess the percentage of people in a town who are 65 years old or older.
You can estimate this percentage by taking a sample. If you ask n people and X of them are 65 or older, your estimated percentage (or proportion) is  . If each person you ask is independent (meaning one person's age doesn't affect another's), this estimate works well.
For a large enough sample, your estimated percentage will be very close to what you'd expect from a normal distribution. Using a common method, you can create a "confidence interval" around your estimate. This interval gives you a range where you're pretty sure the true percentage lies. For example, a 95% confidence interval means you're 95% sure the real percentage is within that range.
The formula for a 95% confidence interval is:
- Failed to parse (Missing <code>texvc</code> executable. Please see math/README to configure.): \left (\widehat p - 1.96\sqrt{\frac{0.25}{n}}, \quad \widehat p + 1.96\sqrt{\frac{0.25}{n}} \right )
Here, `Z` is a standard value (1.96 for 95% confidence), and `n` is your sample size. The `0.25` is used because it's the most "safe" guess for the variation if you don't know the true percentage.
If you want your confidence interval to be a certain width (let's call it W), you can figure out the sample size n you need using this formula:


For example, imagine you want to estimate the percentage of people in the US who support a certain presidential candidate. You want your 95% confidence interval to be no wider than 2 percentage points (meaning your estimate is within 1 percentage point of the true value). Using the formula, you would need a sample size of about 9604 people. It's smart to use the `0.5` (or `0.25` in the formula) for the percentage in this case, because presidential races are often very close to 50/50, and this gives you the largest, safest sample size.
News reports often talk about surveys being "accurate within plus or minus 3 percentage points." This means they used a sample size of about 1000 people. For an accuracy of "plus or minus 1 percentage point," they would need about 10,000 people!
Estimating an Average
When you want to estimate the average of something (like the average height of students in a school), and you have a sample of n independent measurements, the accuracy of your average improves as your sample size grows.
The "standard error" of your sample average tells you how much your sample average might differ from the true average. It's calculated as:

Here, `σ` (sigma) is the standard deviation, which tells you how spread out the data usually is, and `n` is your sample size. This formula shows that as `n` gets bigger, the standard error gets smaller, meaning your estimate becomes more precise.
You can also create a confidence interval for an average. For a 95% confidence interval, it looks like this:
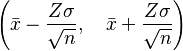
Again, `Z` is 1.96 for a 95% confidence level, and `x̄` is your sample average.
If you want your confidence interval to be a total width of W units, you can find the sample size n you need with this formula:

For example, if you're studying how much a new medicine lowers blood pressure, and you want your 95% confidence interval to be 6 units wide, and you know that blood pressure usually varies by 15 units (this is your `σ`), then you would need a sample size of about 97 people. You always round up, because you need at least that many people.
Sample Sizes for Testing Ideas
Scientists often need to figure out how many people or animals they need in a study to be able to clearly test an idea (a "hypothesis"). This is about having enough "power" in your test to see a real difference if one exists.
Using Tables
Sometimes, you can use pre-made tables to estimate sample sizes. For example, if you're comparing two groups (like a group getting a new treatment and a control group getting no treatment), you can use a table like the one below.
Power |
Cohen's d | ||
|---|---|---|---|
| 0.2 | 0.5 | 0.8 | |
| 0.25 | 84 | 14 | 6 |
| 0.50 | 193 | 32 | 13 |
| 0.60 | 246 | 40 | 16 |
| 0.70 | 310 | 50 | 20 |
| 0.80 | 393 | 64 | 26 |
| 0.90 | 526 | 85 | 34 |
| 0.95 | 651 | 105 | 42 |
| 0.99 | 920 | 148 | 58 |
This table helps you find the sample size for each group (assuming they are equal in size) if you want a 0.05 significance level (meaning there's a 5% chance of saying there's a difference when there isn't one).
- Power: This is how likely you are to find a real difference if one truly exists. Higher power means you're more likely to spot it.
- Cohen's d: This is a way to measure how big the expected difference is between your groups, compared to how much the data usually varies. A larger Cohen's d means a bigger, easier-to-spot difference.
For example, if you want 80% power to detect a "medium" effect size (Cohen's d = 0.5), you would need 64 individuals in each group, for a total of 128 individuals.
Mead's Resource Equation
Mead's resource equation is a simpler way to estimate sample sizes, often used for lab experiments, especially with animals. It's not as precise as other methods, but it gives you a good starting point when you don't know much about the expected results.
The equation is:

where:
- N is the total number of individuals or units in your study (minus 1).
- B is for any "blocking" you do, like if you divide your study into different environments (minus 1).
- T is for the "treatment" groups, meaning the number of different groups you're comparing (like a treatment group and a control group, minus 1).
- E is the "error component," and it should ideally be between 10 and 20. If E is too high, your sample might be too big; if it's too low, it might be too small.
For instance, if you plan a study with lab animals, using four treatment groups (so T=3) and eight animals per group, that's 32 animals total (N=31). If you don't divide them into other groups (B=0), then E would be 28. Since 28 is above 20, it suggests that 32 animals might be a bit too many, and maybe six animals per group would be enough.
Studying Different Groups (Stratified Sampling)
When you use more complex ways of sampling, like stratified sampling, you often divide your total sample into smaller groups called "sub-samples." For example, if you're surveying a school, you might want to make sure you get enough students from each grade level. Each grade level would be a "stratum," and you'd decide how many students to pick from each.
The total sample size is just the sum of all these sub-sample sizes. Deciding how many to pick from each group can be done in smart ways to get the most accurate results.
There are many reasons to use this method: it can make your estimates more accurate, help you study specific groups, or even save money (for example, by sampling more people in areas that are easy to reach).
Qualitative Research Sample Sizes
In qualitative studies (where you explore ideas and experiences, often through interviews or observations, rather than just numbers), deciding the sample size is different. It's usually a more flexible process that happens as the research goes on.
One common approach is to keep adding participants or material until you reach "saturation." This means you're no longer hearing new information or ideas, and you feel you've explored the topic enough. There isn't a strict formula for this, but researchers have studied how many people are typically needed to reach saturation in different types of qualitative studies.
See also
 In Spanish: Tamaño de la muestra para niños
- Design of experiments
