
Single-line diagram facts for kids
A single-line diagram (also called a one-line diagram) is a special kind of drawing used by engineers to show how electricity flows in a power system. Think of it like a simplified map for electricity! Even though real power systems have many wires (like three wires for a three-phase system or two for direct current), a single-line diagram uses just one line to represent all of them. This makes the diagram much easier to understand and work with.
Engineers use these diagrams to study how electricity moves from where it's made (like a power plant) to where it's used (like your home). They use special symbols for different parts of the system, such as circuit breakers, transformers, and electric generators. The diagram shows the path electricity takes, but it doesn't show the actual size or exact location of the equipment. It's more about understanding the connections and the flow of power.

Contents
What are Buses in a Power System?
In a single-line diagram, the lines connect to points called buses. Imagine a bus as a meeting point where electricity can either come into the system or be used up. For big power systems, these buses are actual metal bars called busbars that connect many different electrical parts.
Each bus has a certain amount of electricity flowing through it, which engineers measure as a "voltage phasor." By knowing the voltage at all the buses, engineers can understand the overall "state" of the power system. Today, special tools called phasor measurement units help measure these voltages very accurately.
Why Use One-Line Diagrams for Balanced Systems?
Most large power systems use something called "three-phase power." This means electricity travels through three wires at once. If the amount of electricity used on each of these three wires is about the same (which engineers call "balanced"), then the whole system can be understood by just looking at what happens on one of the wires. This is a huge help because it makes calculations much simpler!
Using a single-line diagram makes it easier to do these "per-phase analyses." It also leaves more room on the diagram to add other important information, like how much it costs to run different parts of the system.
What About Unbalanced Systems?
Sometimes, a power system can become "unbalanced." This might happen if there's a problem, like a fault on only one or two of the three wires. When this happens, engineers use a special method called "symmetrical components." This method breaks down the unbalanced problem into three separate, simpler problems, each of which can be drawn as its own single-line diagram.
These separate diagrams help engineers see how different parts of the system react to unbalanced conditions. For example, a generator might behave differently depending on how the phases are unbalanced, and some transformer connections can even block certain types of unbalanced currents. By using these three diagrams together, engineers can figure out exactly what's happening in an unbalanced system.
See also
- Electrical drawing
 In Spanish: Esquema unifilar para niños
Images for kids
-
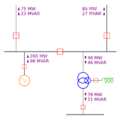
A typical one-line diagram showing power paths. Red boxes are circuit breakers, grey lines are connections, the orange circle is an electric generator, the green spiral is an inductor, and the blue circles are a transformer.
