Bawcomville, Louisiana facts for kids
Quick facts for kids
Bawcomville, Louisiana
|
|
|---|---|
| Country | United States |
| State | Louisiana |
| Parish | Ouachita |
| Area | |
| • Total | 3.74 sq mi (9.70 km2) |
| • Land | 3.17 sq mi (8.20 km2) |
| • Water | 0.58 sq mi (1.50 km2) |
| Elevation | 79 ft (24 m) |
| Population
(2020)
|
|
| • Total | 3,472 |
| • Density | 1,096.31/sq mi (423.25/km2) |
| Demonym(s) | Bawcomite |
| Time zone | UTC-6 (Central (CST)) |
| • Summer (DST) | UTC-5 (CDT) |
| ZIP code |
71292
|
| Area code(s) | 318 |
| GNIS feature ID | 542961 |
Bawcomville is a small place in Ouachita Parish, Louisiana, United States. It is called an unincorporated community. This means it does not have its own local government like a city or town. Instead, it is managed by the larger Ouachita Parish. It is also a census-designated place, which is an area the government uses for counting people.
In 2020, about 3,472 people lived in Bawcomville.
Contents
Exploring Bawcomville's Location
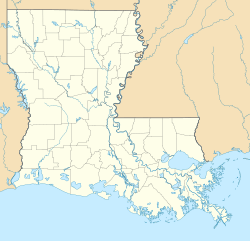
Bawcomville is located in the state of Louisiana. It is part of Ouachita Parish, which is like a county in other states.
How Big is Bawcomville?
According to the U.S. Census Bureau, Bawcomville covers an area of about 3.74 square miles. Most of this area, about 3.17 square miles, is land. The rest, about 0.58 square miles, is water.
Before 2010, Bawcomville was counted together with another place called Brownsville. They were part of a larger area for population counting.
People of Bawcomville
The population of Bawcomville has been counted by the U.S. government. Here is how the number of people has changed over time:
| Historical population | |||
|---|---|---|---|
| Census | Pop. | %± | |
| 2020 | 3,472 | — | |
| U.S. Decennial Census | |||
Who Lives in Bawcomville?
In 2020, there were 3,472 people living in Bawcomville. These people lived in 1,270 households. A household is a group of people living together in one home. There were also 614 families.
The table below shows the different groups of people living in Bawcomville in 2020:
| Race | Number | Percentage |
|---|---|---|
| White (non-Hispanic) | 2,514 | 72.41% |
| Black or African American (non-Hispanic) | 334 | 9.62% |
| Native American | 19 | 0.55% |
| Asian | 11 | 0.32% |
| Other/Mixed | 220 | 6.34% |
| Hispanic or Latino | 374 | 10.77% |


