
Confidence interval facts for kids
In statistics, a confidence interval (CI) is a special range of numbers used when we want to guess a certain value, like the average height of all students in a school. Instead of just giving one number as our guess, a confidence interval gives us a whole range of possible values. It also tells us how likely it is that the true value we're trying to guess falls within that range.
For example, if we're not sure of the exact number of cars that crossed a bridge, we might say "400 cars, plus or minus 10." This means we think the number is somewhere between 390 and 410.
This range is figured out by looking at a small group (a "sample") from the larger group we're interested in. Because each sample is different, the confidence interval will also be slightly different each time. The chance that the true value is inside our range is called the confidence level. This is often given as a percentage, like a "95% confidence interval." The higher the confidence level you want, the wider your interval will usually be.
Contents
Understanding Confidence Intervals
A confidence interval helps us understand how good our guess is. Imagine you want to know the average weight of all apples in a huge orchard. You can't weigh every single apple! So, you pick a small group of apples (a sample) and weigh them.
The average weight of your sample apples is a good guess for the average weight of all apples. But how close is your guess to the real average? That's where the confidence interval comes in. It gives you a range, like "the average apple weight is between 150 grams and 160 grams."
How Sure Are We? (Confidence Level)
The "confidence level" tells you how sure you can be about your interval. If you have a 95% confidence interval, it means that if you repeated your sampling process many, many times, about 95% of the intervals you calculate would contain the true average weight of all apples. The other 5% of the time, your interval might miss the true average.
It's important to remember that once you've calculated a specific interval, the true value is either in it or it isn't. We don't say there's a 95% chance the true value is in *that specific interval*. Instead, we say we are 95% confident that our method creates intervals that capture the true value.
A Practical Example: Filling Margarine Cups

Let's look at a real-world example. Imagine a machine that fills cups with margarine. The machine is set to fill each cup with 250 grams. However, no machine is perfect, so the amount in each cup varies a little bit. This small variation is normal.
To check if the machine is working correctly, a factory worker takes a random group of 25 cups. They weigh the margarine in each of these 25 cups. Let's say the average weight of margarine in these 25 cups turns out to be 250.2 grams.
Why We Need a Range
If the worker took another sample of 25 cups, the average weight might be 250.4 grams or 251.1 grams. It's unlikely to be something very different, like 280 grams, if the machine is set correctly.
So, instead of just saying "the average is 250.2 grams," we want to find a range around 250.2 grams where the true average weight of all cups (if the machine is working perfectly) would likely fall. This range is our confidence interval.
Calculating the Interval (Simplified)
In our margarine example, let's say we want a 95% confidence interval. After doing some calculations (which involve how much the weights usually vary and how many cups we sampled), we might find that our interval is:
(250.2 - 0.98 grams) to (250.2 + 0.98 grams)
This means our 95% confidence interval is from 249.22 grams to 251.18 grams.

Since the desired weight of 250 grams falls within this interval (249.22 to 251.18), we can be 95% confident that the machine is calibrated correctly. If 250 grams was outside this range, we might think the machine needs adjusting.
The image on the right shows what happens if you take many different samples and calculate a confidence interval for each. The dashed line is the true average. You can see that most of the vertical lines (which represent the confidence intervals) cross the dashed line, meaning they contain the true average. But a few of them don't! This shows why we use "confidence" and not "certainty."
Related Ideas
- Margin of error: This is half the width of the confidence interval. It tells you how much your sample result might differ from the true population value.
- Prediction interval: This is a range that predicts where a *future* single observation will fall, rather than where the true average of a whole population is.
Images for kids
-
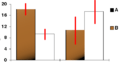
In this chart, the tops of the brown bars show observed averages, and the red lines (error bars) show the confidence intervals around them.

See also
 In Spanish: Intervalo de confianza para niños
